Mathematics · Ch 1 — Sets
Venn Diagrams
Venn Diagrams
1.8 Venn Diagrams
Most relationships between sets can be shown using diagrams. These are called Venn diagrams, after the English logician John Venn (1834–1883). A Venn diagram uses a rectangle to represent the universal set , and closed curves — usually circles — inside it to represent subsets. The elements of each set are written inside the corresponding circle.
Illustration 1
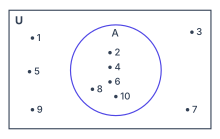
In the diagram below (Fig 1.2 in the textbook), is the universal set. The subset is shown as a circle inside the rectangle. Every element of lies inside the circle; the remaining elements of lie outside it but inside the rectangle.
Illustration 2
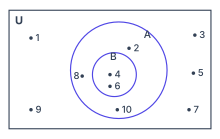
In Fig 1.3, the same universal set contains two subsets: and . Since every element of is also in , we have . In the Venn diagram, the circle for is drawn completely inside the circle for .
Venn diagrams are not formal proofs — they are visual aids. They help you see relationships like subset, union, intersection, and difference at a glance. You will use them extensively when working with these operations.
The textbook does not list any formal properties, theorems, or derivations in this section. It simply introduces the idea of Venn diagrams and gives two illustrations. The section is a conceptual foundation for the operations that follow. There are no formulas, equations, or quantitative results to state here.
The universal set is always drawn as a rectangle. Subsets are drawn as circles (or other closed curves) inside it. The relative positions of the circles show the relationships between the sets — overlapping for intersection, one inside another for subset, separate for disjoint sets, and so on.
Key idea to remember …
Drawn by us to help you understand the concept clearly, and verified to make sure it's accurate. For exams, practice from your textbook's own diagram.
Fig. 1.2 is the simplest possible Venn diagram — a single circle inside a rectangle. The rectangle is labelled and represents the universal set, which in this case is . The circle inside it is labelled and represents a subset of . The elements of are shown as dotted points placed either inside the circle or outside it, depending on whether they belong to or not.
The points lie inside the circle , so . The points lie inside the rectangle but outside the circle, meaning they belong to but not to . The diagram therefore shows visually that is a subset of , written , and that contains exactly the even numbers from to .
The physical idea is simple but powerful: a Venn diagram turns a set relationship into a spatial picture. The rectangle gives the "universe" of all possible elements, and each closed curve (here a circle) carves out the region belonging to a particular set. An element's membership is decided by which region it falls into — inside the circle means "in ", outside the circle but inside the rectangle means "in but not in ". This is the foundation for representing union, intersection, and difference later in the chapter.
The dotted points are not part of the standard Venn diagram notation — they are included here only to show the actual elements. In most later diagrams, only the set names appear inside the regions, not the individual elements.
The key formula that this figure illustrates is the definition of a subset:
…
Drawn by us to help you understand the concept clearly, and verified to make sure it's accurate. For exams, practice from your textbook's own diagram.
Fig 1.3 is a Venn diagram that shows the relationship of subset between two sets. The universal set is the rectangle containing everything. Inside it, two circles are drawn: a larger circle labelled and, completely inside , a smaller circle labelled . The fact that lies entirely within is the visual representation of — every element of is also an element of .
The elements of are placed as points inside the appropriate regions. The numbers and sit inside the inner circle (and therefore also inside ). The numbers , , and lie inside but outside — they belong to but not to . The numbers , , , , are placed outside both circles but still inside the rectangle ; they belong to the universal set but to neither nor .
So the diagram tells you, at a glance:
- (the inner circle is completely inside the outer one)
The subset relation is the key idea this figure teaches. In a Venn diagram, if one set is a subset of another, its circle is drawn entirely inside the other circle — no part of the smaller circle pokes outside.
The textbook uses this figure to prepare you for the operations of union, intersection, and difference. Once you see that sits inside , you can immediately read off:
- The intersection is — the region where the two circles overlap (here, the whole of ).
- The difference (or ) is — the part of outside .
- The union is just itself, , because adds no new elements.
A common mistake is to think that if , then and must share all elements. They don't — is a proper subset here, so has elements () that are not in . The diagram makes this clear by showing numbers outside but inside . …