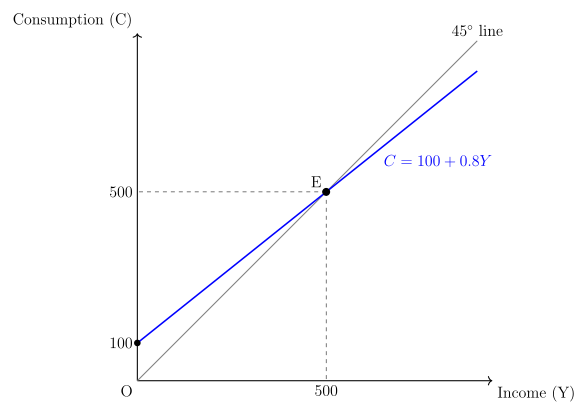
Q.Choose the correct consumption function from the options given below with reference to the illustrated given diagram. (Diagram: X-axis = Income, Y-axis = Consumption; a 45° Income Line; a consumption curve C with a positive intercept of 100; equilibrium point E where the C curve cuts the 45° line; dashed lines mark C = 280 at one income level and C = 700 at income = 800.) Options : (A) C = 100 + 0.7Y (B) C = 100 + 0.8Y (C) C = 100 – 0.7Y (D) C = 100 – 0.8Y
You're viewing a preview — the full solution, concept, methods & PYQ mapping are locked.
Start your 14-day free trial to unlock the full solution →The consumption curve has autonomous consumption (its vertical intercept) and its slope is the MPC. Using the break-even point where the curve cuts the line (), the MPC works out to exactly , so the consumption function is — option (B).
The consumption function and its components
A consumption function describes the relationship between national income and aggregate consumption . The standard Keynesian form is
where is autonomous consumption (consumption when income is zero — the vertical intercept) and is the marginal propensity to consume (MPC), the fraction of each additional rupee of income spent on consumption, and geometrically the slope of the line.
The diagram gives us two facts. First, the consumption curve has a positive vertical intercept of , so . Second, the curve is upward-sloping, which immediately rules out options (C) and (D): a negative coefficient would mean consumption falls as income rises, contradicting both theory and the diagram.
Finding the MPC from the break-even point
The cleanest way to read the slope off this diagram is the break-even point , where the consumption curve intersects the line. Along the line every point satisfies , so at consumption exactly equals income. From the diagram, this occurs at .
Substituting and the point into :
…
Unlock everything free for 14 days
- Full step-by-step solutions
- Concept-first explanations
- Methods, shortcuts & mistakes
- PYQ mapping + timed mock tests
Full access for 14 days. No credit card required.