Economics · Ch 7 — Index Numbers
The Aggregative Method
The Aggregative Method
Simple (unweighted) aggregative index. Add up the current-period prices, divide by the sum of base-period prices, and multiply by 100:
where and are current- and base-period prices. For the four commodities:
so prices have risen by 38.5 per cent. This index is of limited use: the price units of different commodities are not the same, and being unweighted it treats all items as equally important. In reality items differ in importance — food takes a large share of spending — so an equal price rise in a heavily-consumed item and a minor one affect the overall index very differently.
Weighted aggregative index. Weights (here quantity weights) fix a well-specified basket of goods and value it each year; because the basket is fixed, any change in total value is due to price:
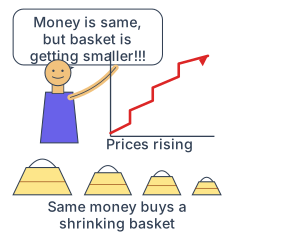
Drawn by us to help you understand the concept clearly, and verified to make sure it's accurate. For exams, practice from your textbook's own diagram.
Our own line-art recreation of the NCERT cartoon printed on page 110, right where the weighted aggregative index (Laspeyre's and Paasche's methods) is introduced. It illustrates the real-world effect a weighted aggregative price index is meant to capture — the same money buying a shrinking basket as prices rise. The scene and caption are taken from the textbook as facts; …
- Laspeyre's index uses base-period quantities as weights. With the sample data — a 35.3 per cent rise. It answers: if base-period spending on the basket was Rs 100, what would the same basket cost now?
- Paasche's index uses current-period quantities as weights: …