Physics · Ch 10 — Thermal Properties of Matter
Blackbody Radiation
Blackbody Radiation
Blackbody Radiation
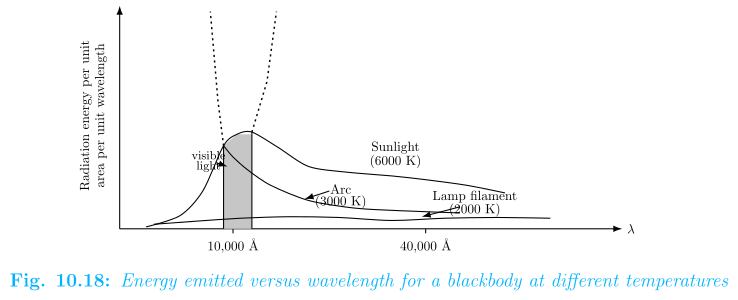
Thermal radiation is not confined to a single wavelength. At any given temperature, it is spread over a continuous range of wavelengths, and the amount of energy carried differs from one wavelength to another. Figure 10.18 (above) shows the experimentally measured curves of radiation energy emitted per unit area per unit wavelength, plotted against wavelength, for a blackbody radiator at a few representative temperatures — sunlight (about 6000 K), an electric arc (about 3000 K), and a lamp filament (about 2000 K).
The single most important feature of these blackbody curves is that they are universal — for a given temperature, the shape of the curve depends only on that temperature, and not on the size, shape, or material of the blackbody.
As already discussed in §10.9.3, two laws summarise the key features of these curves:
- Wien's Displacement Law () describes how the wavelength of peak emission shifts with temperature.
- The Stefan-Boltzmann Law () describes how the total power radiated grows with temperature.
Wien's law is a genuinely useful tool for estimating the surface temperature of distant objects that cannot be touched with a thermometer. Two examples:
- Light from the Moon has its intensity maximum near a wavelength of 14 μm. By Wien's law, this corresponds to a surface temperature of about 200 K.
- Sunlight has its intensity maximum at Å. By Wien's law, this corresponds to a temperature of about 6060 K — the temperature of the Sun's surface, not its much hotter interior. …
Drawn by us to help you understand the concept clearly, and verified to make sure it's accurate. For exams, practice from your textbook's own diagram.
The figure plots spectral radiance — the energy radiated per unit area per unit wavelength — against wavelength . The horizontal axis runs from roughly to (where ). A shaded vertical band marks the visible region of the electromagnetic spectrum, approximately to .
Three distinct curves are drawn, each corresponding to a blackbody at a different temperature:
- Sunlight (6000 K) — the curve peaks well inside the visible band, near . This is why the Sun appears white-yellow to our eyes.
- Arc (3000 K) — the peak has shifted to a longer wavelength, around , which lies in the near-infrared. The visible part of this curve is much lower, so the arc glows orange-red.
- Lamp (2000 K) — the peak is even further into the infrared, near . The visible portion is very small, giving a dull red glow.
The key physical idea is that as temperature decreases, the peak of the emission shifts to longer wavelengths. This is the essence of Wien’s displacement law.
Here is the wavelength at which the emission is maximum (the peak of the curve), and is the absolute temperature in kelvin. The constant is called Wien’s constant.
The textbook uses this figure to introduce Wien’s law and to show that the Sun’s surface temperature (~6000 K) can be estimated simply from the colour of its light. The figure also sets the stage for the Stefan–Boltzmann law, which states that the total power radiated per unit area (the area under the curve) is proportional to :
where is the Stefan–Boltzmann constant. Notice that the 6000 K curve is enormously taller than the 2000 K curve — the area under it is times larger, even though the temperature ratio is only 3. …