Q.Draw the diagram of total production curve of labour.
🔒You're viewing a preview — the full solution, concept, methods & PYQ mapping are locked.
🔒 Start your 14-day free trial to unlock the full solution →Concept understanding — Total Product
Total Product: From a Farmer's Field to a Factory Floor
Imagine you own a small bakery. You have one oven, one mixing bowl, and a single counter. That's your fixed capital — things that don't change in the short run. Now, you start hiring workers. With one worker, you bake 20 loaves a day. With two workers, you get 50 loaves. With three, 90 loaves. With four, 120 loaves. With five, 140 loaves. With six, 150 loaves. With seven, 150 loaves again (the kitchen is too crowded). With eight, 140 loaves (workers start bumping into each other).
That list of numbers — 20, 50, 90, 120, 140, 150, 150, 140 — is your Total Product at each level of labour.
The Precise Meaning
Total Product (TP) is the total quantity of output produced by a firm using a given amount of variable input (like labour), with all other inputs held fixed (like machinery, land, factory size). In the NCERT Class-12 Economics textbook, it is defined as:
TP=∑MP
or equivalently
TPn=MP1+MP2+⋯+MPn
Where:
- TP = Total Product (total output in physical units — loaves, metres, tonnes)
- MP = Marginal Product (the extra output from adding one more unit of the variable input)
- n = the number of units of the variable input employed
There is no separate "formula" for TP beyond this additive relationship. It is simply the sum of all marginal products up to that point. If you know the output at each level, you have TP directly.
Why It Matters
Total Product is the foundation of production analysis. Without it, you cannot calculate:
- Average Product (AP) = TP/L (output per worker) — tells you how productive each worker is on average.
- Marginal Product (MP) = change in TP / change in labour — tells you the contribution of the last worker hired.
- The Law of Diminishing Marginal Returns — which is the single most important pattern in short-run production.
The Three Stages (The Shape of the TP Curve)
If you plot TP on the vertical axis and labour on the horizontal axis, the curve typically looks like a hill that eventually flattens and then falls. NCERT describes three phases:
-
Increasing returns to a factor (TP rises at an increasing rate) — the slope of TP gets steeper. This happens when workers specialise and the fixed capital is underutilised. In our bakery, from 1 to 3 workers, each new worker adds more than the previous one (20, then 30, then 40 loaves).
-
Diminishing returns to a factor (TP rises at a decreasing rate) — the slope of TP gets flatter. This is the most common phase. From 4 to 6 workers, each new worker adds less (30, then 20, then 10 loaves). The oven and counter space are becoming crowded.
-
Negative returns (TP actually falls) — the slope becomes negative. Beyond 7 workers, output drops because workers get in each other's way.
A common mistake …
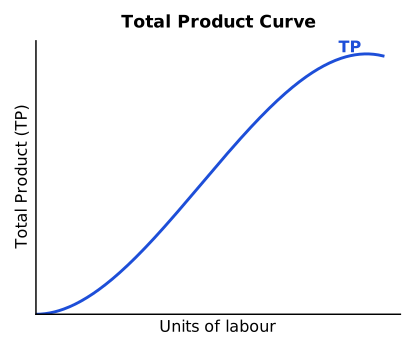
The total product (TP) curve of labour shows how total output changes as more units of labour are employed with a fixed amount of other inputs. It is typically S-shaped: output first rises at an increasing rate, then at a diminishing rate, reaches a maximum, and may finally fall. …
The total product curve of labour is an S-shaped curve: TP rises at an increasing rate, then at a decreasing rate, peaks, and finally falls as more labour is added to fixed capital.
In the RBSE/CBSE Class-12 production-and-costs chapter, when only labour is varied and all other inputs (like capital) are held fixed, the total product of labour (TP) passes through three phases, giving the curve its characteristic S-shape.
How to draw it:
- Axes: X-axis = units of labour (L); Y-axis = total product (TP).
- Phase 1 (increasing returns): From the origin the TP curve rises at an increasing rate (gets steeper) — marginal product is rising.
- Phase 2 (diminishing returns): TP continues to rise but at a decreasing rate (gets flatter) — marginal product is positive but falling.
- Peak: TP reaches its maximum point, where marginal product = 0. …
- CBSE 2026Set ANNUAL1 markMCQQ.If the total output of a firm is 800 units on 10 units of variable inputs, then the average production will be A) 80 B) 100 C) 8 D) 400
›Reveal solutionSolution
Average product = 800 ÷ 10 = 80, so the answer is A.
Average Product (AP) = Total Product (TP) ÷ quantity of the variable input used. Here TP = 800 units and the variable input = 10 units, so AP = 800 ÷ 10 = 80 units. This is a direct application …
- CBSE 2024Set ANNUAL1 markMCQQ.When the Average Product (AP) is maximum, then the Marginal Product (MP) is (A) Equal to AP (B) Less than AP (C) More than AP (D) All of these
›Reveal solutionSolution
When AP is maximum, MP = AP, so the answer is (A).
In the BSEB Inter Class-12 Economics (Production and Costs) syllabus, there is a fixed relationship between Average Product (AP) and Marginal Product (MP): when MP > AP, AP rises; when MP < AP, AP falls; and at the point where AP is at its maximum, MP equals AP. Geometricall …
- CBSE 2022Set ANNUAL1 markMCQQ.(xi) The shape of Average Product curve is (A) U shaped (B) Inverse U shaped (C) Horizontal (D) Vertical
›Reveal solutionSolution
The average product curve is inverse-U shaped — option (B).
As more units of a variable factor are applied to a fixed factor, average product (AP) first increases (due to better factor utilisation), reaches a maximum, and then decreases (due to the law of diminishing returns). A curve that rises …
- CBSE 2022Set ANNUAL1 markQ.Fill in the blank:(vi) ______ function shows the relationship between inputs and outputs.
›Reveal solutionSolution
The function showing the input-output relationship is the production function.
The production function expresses the maximum quantity of output a firm can produce from different combinations of inputs (such as labour and capital), given the state of technology. It th …
- CBSE 2022Set ANNUAL1 markQ.Answer in 10-20 words:(xi) Write the formula to calculate marginal product.
›Reveal solutionSolution
MP = ΔTP ÷ ΔL, or for the nth unit, MPn = TPn − TPn-1.
Marginal product (MP) of a variable factor is the extra output produced when one more unit of that factor is employed, other factors held constant. It is calculated as the change in total product (ΔTP) divided by the change in the quantity of the variable factor (ΔL):
…
- CBSE 2022Set ANNUAL1 markMCQQ.The production function of a firm is -(a) Production(b) Relationship between inputs and outputs(c) Cost(d) Factor
›Reveal solutionSolution
A production function is the relationship between inputs and outputs — option (b).
The production function expresses the technical (physical) relationship between the quantities of factor inputs used and the maximum quantity of output that can be produced from them, with a given technology: Q = f(L, K, …). It tells us how much output can …
- CBSE 2020Set MARCH1 markMCQQ.The change in output per unit of the change in the input is called(a) a) Marginal product(b) b) Average Product(c) c) Total product(d) d) Product
›Reveal solutionSolution
Change in output per unit change in input = Marginal Product.
In the theory of production, marginal product (MP) is defined as the addition to total output caused by employing one more unit of the variable factor: MP=ΔTP/ΔL. Average product is total product divided b …
- CBSE 2019Set 58/3/11 markQ.The marginal product curve in the input-output plane, looks like ____________: (Choose the correct alternative)(a) a 'U' shaped curve(b) an inverse 'U' shaped curve(c) an inverse 'S' shaped curve(d) an 'S' shaped curve
›Reveal solutionSolution
The marginal product curve illustrates the Law of Variable Proportions, initially rising due to increasing returns and then falling due to diminishing returns, resulting in an inverse 'U' shape.
To understand the shape of the marginal product curve, we must first grasp the concept of marginal product itself and the fundamental economic principle known as the Law of Variable Proportions.
Marginal Product (MP) refers to the additional output produced by employing one more unit of a variable input, while keeping all other inputs constant. For example, if a firm increases its labor from 5 to 6 workers and total output rises from 100 units to 115 units, the marginal product of the 6th worker is 115−100=15 units.
Marginal Product (MPn) of the n-th unit of variable input is given by:
MPn=TPn−TPn−1
where TPn is the Total Product with n units of the variable input, and TPn−1 is the Total Product with n−1 units.
Alternatively, MP=ΔLΔTP, where ΔTP is the change in Total Product and ΔL is the change in the variable input (e.g., labor).
The shape of the marginal product curve is dictated by the Law of Variable Proportions, which operates in the short run when at least one input is fixed (e.g., land, machinery) and another is variable (e.g., labor). This law describes three stages of production:
-
Stage of Increasing Returns to a Factor: Initially, as more units of the variable input are added to a fixed input, the marginal product tends to increase. This happens because of better utilization of the fixed factor, specialization of labor, and improved coordination. For instance, adding a second worker to a single machine might allow for division of tasks, making both more productive than a single worker. During this stage, the MP curve slopes upwards.
-
Stage of Diminishing Returns to a Factor: After a certain point, as more units of the variable input are continuously added to the fixed input, the marginal product begins to decrease. This is the most common and significant stage. The fixed factor becomes relatively scarce compared to the increasing variable factor. Overcrowding, less efficient use of machinery, and coordination difficulties set in. Each additional unit of the variable input still adds to total output, but by a smaller amount than the previous one. During this stage, the MP curve slopes downwards but remains positive. …
-
🎓Unlock everything free for 14 days
- ✓Full step-by-step solutions
- ✓Concept-first explanations
- ✓Methods, shortcuts & mistakes
- ✓PYQ mapping + timed mock tests
Full access for 14 days. No credit card required.