Question of 35
Q.Draw the budget line diagram.
Rajasthan RbseRBSE Rajasthan Senior Secondary (Class-12) Commerce Board 2020Subjective· 2mImportance★★★★★
0% · 0/35 Questions
You're viewing a preview — the full solution, concept, methods & PYQ mapping are locked.
Start your 14-day free trial to unlock the full solution →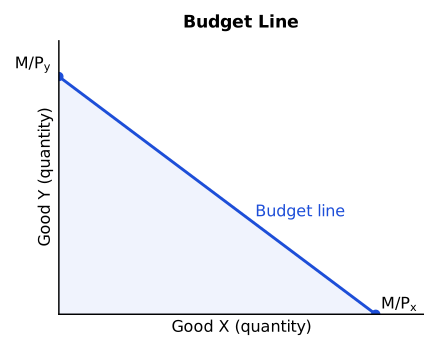
The budget line is a straight, downward-sloping line showing every combination of two goods a consumer can buy by spending the whole of a given income at given prices.
Suppose a consumer has a fixed money income M and buys two goods, X and Y, with prices Px and Py.
- If the entire income is spent only on good X, the consumer can buy M ÷ Px units — this is the point on the horizontal (X) axis.
- If the entire income is spent only on good Y, the consumer can buy M ÷ Py units — this is the point on the vertical (Y) axis.
Joining these two intercept points with a straight line gives the budget line (also called the price line or budget constraint).
Diagram (described):
- Vertical axis = quantity of Good Y; horizontal axis = quantity of Good X.
- Mark point A on the Y-axis at M ÷ Py and point B on the X-axis at M ÷ Px.
- Join A and B with a straight line sloping downward from left to right — this line AB is the budget line. …
Unlock everything free for 14 days
- Full step-by-step solutions
- Concept-first explanations
- Methods, shortcuts & mistakes
- PYQ mapping + timed mock tests
Full access for 14 days. No credit card required.