Q.Explain with the help of a diagram the change in budget set due to changes in consumer's income. [2+2=4] OR Explain with the help of a diagram the change in budget set due to changes in price of goods. [2+2=4]
You're viewing a preview — the full solution, concept, methods & PYQ mapping are locked.
Start your 14-day free trial to unlock the full solution →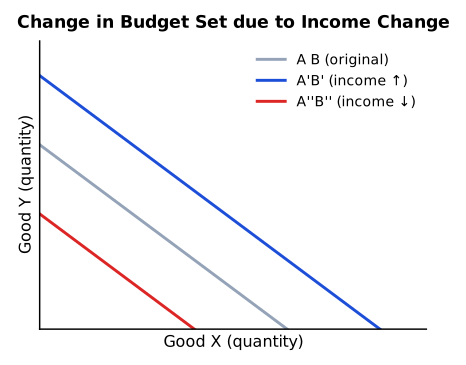
Income change = parallel shift of the budget line (slope unchanged); price change = rotation/pivot of the budget line (slope changes). Diagrams described below.
Change in budget set due to a change in income (diagram described).
The budget line shows all combinations of two goods (say good 1 on the horizontal axis, good 2 on the vertical axis) that a consumer can buy by spending the whole income M at prices p1 and p2. Its equation is p1·x1 + p2·x2 = M, with horizontal intercept M/p1 and vertical intercept M/p2, and slope −p1/p2.
When income rises (prices unchanged), both intercepts M/p1 and M/p2 increase, so the budget line shifts outward (to the right) parallel to the original, because the slope −p1/p2 is unchanged. The budget set (the attainable region) becomes larger. A fall in income shifts the line inward parallel to itself, shrinking the budget set. (Diagram: original line AB; higher income gives a parallel outer line A'B'; lower income gives a parallel inner line A''B''.)
OR — Change in budget set due to a change in the price of a good (diagram described). …
Unlock everything free for 14 days
- Full step-by-step solutions
- Concept-first explanations
- Methods, shortcuts & mistakes
- PYQ mapping + timed mock tests
Full access for 14 days. No credit card required.