Q.Draw a diagram of an indifference curve.
🔒You're viewing a preview — the full solution, concept, methods & PYQ mapping are locked.
🔒 Start your 14-day free trial to unlock the full solution →Concept understanding — Monotonic Preferences
Monotonic Preferences – The "More is Better" Rule
Think about the last time you chose between two plates of food. If one plate had everything the other had, plus an extra piece of chicken, which would you pick? The bigger one, obviously. That instinct — that more of a good thing is always better — is the entire idea behind monotonic preferences.
The Everyday Intuition
Suppose you are comparing two consumption bundles: Bundle A has 5 apples and 3 bananas. Bundle B has 5 apples and 4 bananas. If you prefer bananas (and you're not allergic), you will pick B. Why? Because B gives you at least as much of every good as A, and strictly more of at least one good (bananas). You would never choose A over B unless you had some weird reason to dislike extra bananas.
This is monotonicity: a consumer always prefers a bundle that has more of at least one good and no less of any other good. In plain language: you cannot have too much of a good thing.
The Precise Definition (NCERT Class 12, Microeconomics)
Monotonic Preferences: For any two bundles X=(x1,x2) and Y=(y1,y2), if x1≥y1 and x2≥y2 (with at least one strict inequality), then X≻Y (X is strictly preferred to Y).
Here:
- x1,x2 = quantities of good 1 and good 2 in bundle X
- y1,y2 = quantities of good 1 and good 2 in bundle Y
- ≻ means "strictly preferred to"
The key condition: at least as much of every good, and strictly more of at least one good. If both goods are increased, the preference is even stronger.
What It Is NOT
Monotonic preferences do not mean:
- You like everything (you might hate onions — but then onions are a "bad," not a good)
- You always want more of every good simultaneously (you might be indifferent between two bundles if one has more of good 1 but less of good 2)
- Preferences are transitive or complete (those are separate assumptions)
Why It Matters in Economics
Monotonicity is one of the three core assumptions about consumer preferences in standard microeconomics (along with completeness and transitivity). Without it, the entire theory of demand collapses.
Here is why:
1. Indifference curves slope downward. If preferences are monotonic, then to keep a consumer equally satisfied, if you give them more of good 1, you must take away some of good 2. Otherwise, they'd be better off. This gives indifference curves their characteristic negative slope.
2. Higher indifference curves mean higher satisfaction. A curve farther from the origin represents bundles with more of both goods — and monotonicity says those are strictly preferred. So "higher" = "better."
3. The consumer's optimum is on the budget line. If more is always better, a rational consumer will never leave money unspent. They will choose a bundle on the budget line, not inside it. …
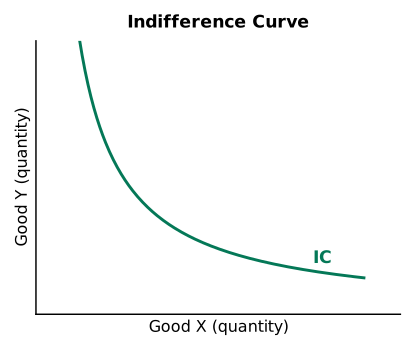
An indifference curve shows all combinations of two goods giving a consumer equal satisfaction. It is drawn as a smooth curve that slopes downward from left to right and is convex to the origin. …
An indifference curve is a downward-sloping curve, convex to the origin, showing combinations of two goods giving equal satisfaction.
An indifference curve is the locus of all combinations of two goods (say Good X and Good Y) that give the consumer the same level of total satisfaction (utility). It is therefore a curve of equal satisfaction.
Diagram (described): On a graph with the quantity of Good X on the horizontal axis and the quantity of Good Y on the vertical axis, the indifference curve (labelled IC) starts high on the left and falls to the right. As you move down the curve, more of Good X is combined with less of Good Y while satisfaction stays constant.
…
Showing the 12 most recent of 46 on this concept.
- CBSE 2026Set MARCH1 markMCQQ.Ordinal utility analysis expresses utility in(a) a) Numbers(b) b) Returns(c) c) Ranks(d) d) Ratios
›Reveal solutionSolution
In the ordinal utility approach a consumer only ranks combinations of goods by preference; the correct answer is (c) Ranks.
The cardinal utility approach (Marshall) assumes satisfaction can be measured in exact numbers called 'utils'. The ordinal approach (Hicks and Allen), used in the Karnataka 2nd PUC theory of consumer behaviour, argues that a consumer cannot say how much satisfaction a good gives, but can definitely say which bundle he prefers to another. Utility is therefore expressed by ordering or ranking the bundles.
- (a) Numbers — this is the cardinal approach, not ordinal. …
- CBSE 2026Set MARCH1 markQ.MRS – Expand.
›Reveal solutionSolution
MRS expands to Marginal Rate of Substitution.
The Marginal Rate of Substitution (MRS) is the rate at which a consumer is willing to give up units of one good to obtain one more unit of another good while remaining on the same indifference curve (i.e., keeping total satisfaction unchanged). It is the numerical value of …
- CBSE 2026Set ANNUAL1 markMCQQ.Indifference curve slopes always is A) Parallel to the horizontal axis B) Left to right upwards C) Left to right downwards D) Right to left upwards
›Reveal solutionSolution
An indifference curve always slopes downward from left to right, so the answer is C.
An indifference curve shows combinations of two goods that give the consumer the same level of satisfaction. With monotonic preferences, if the consumer gets more of one good, some of the other good must be given up to keep total satisfaction unchanged. This inverse relationship makes the curve slope downward (negatively) from left to r …
- CBSE 2026Set ANNUAL1 markMCQQ.Which of the following is a formula of marginal rate of substitution? A) MRS = Y/X B) MRS = ΔX/ΔY C) MRS = X/Y D) MRS = ΔY/ΔX
›Reveal solutionSolution
MRS = ΔY/ΔX, so the answer is D.
The marginal rate of substitution (MRS) of good X for good Y is the rate at which a consumer is willing to sacrifice good Y to obtain one additional unit of good X while remaining on the same indifference curve. It is therefore the ratio of the change in good Y to the change in good X: MRS = ΔY/ΔX, which is also the (absolute) s …
- CBSE 2026Set ANNUAL1 markQ.Explain the cardinal utility analysis.
›Reveal solutionSolution
Cardinal utility analysis treats utility as measurable in exact numbers (utils).
Cardinal utility analysis (associated with Marshall) assumes that the satisfaction (utility) a consumer gets from consuming goods can be measured in absolute, countable units called 'utils' — for example 10 utils from one apple and 6 utils from the next. Because utility is assumed quantifiable, it can be added up and compared across goods, and the analysis uses the law of diminishing marginal utility to explain consumer behaviour. This contrasts with the ordinal approach (indifference curves), which only ranks preferences. This forms part of the Class …
- CBSE 2026Set ANNUAL1 markQ.Write the answer in one sentence: Write the formula of marginal rate of substitution.
›Reveal solutionSolution
MRS (of X for Y) = ΔY / ΔX — the units of Y sacrificed for one more unit of X.
The marginal rate of substitution (MRS) is the rate at which a consumer is willing to give up units of one good to obtain one additional unit of the other, while remaining on the same indifference curve (same satisfaction). Its formula is:
MRS(of X for Y) = ΔY / ΔX
…
- CBSE 2026Set ANNUAL1 markMCQQ.Higher indifference curve shows the level of utility is one of the following:(a) Higher level(b) Lower level(c) Same level(d) Negative level
›Reveal solutionSolution
A higher indifference curve shows a higher level of utility — option (a).
A higher indifference curve lies farther from the origin and therefore represents combinations containing more of both goods (or more of one and no less of the other). Under monotonic preferences, more is preferred to less, so a high …
- CBSE 2026Set ANNUAL1 markMCQQ.Write True or False: On the basis of cardinal utility analysis the level of utility can be expressed in numbers.(a) True(b) False
›Reveal solutionSolution
True — cardinal utility is measurable in numbers.
The cardinal utility approach (Marshall) assumes that utility is measurable in absolute numbers, expressed in units called utils (e.g., 10 utils from the first unit, 6 from the second). This is distinct from the ordinal utility approach (indifference-curve analysis), where utility is only ranked, not measured. So under cardinal analysis, the …
- CBSE 2026Set ANNUAL1 markMCQQ.How we calculate Marginal Utility?(a) MUn = TUn - TUn-1(b) MUn = TUn / TUn-1(c) MUn = TUn-1 / TUn(d) MUn = TUn + TUn-1(a) MUn = TUn - TUn-1(b) MUn = TUn / TUn-1(c) MUn = TUn-1 / TUn(d) MUn = TUn + TUn-1
›Reveal solutionSolution
MU of the nth unit = TU(n) − TU(n−1).
Total Utility (TU) is the sum of satisfaction from ALL units consumed so far. The Marginal Utility (MU) of a SPECIFIC unit (the nth unit) is just the EXTRA satisfaction that particular unit adds — found by subtracting the total utility BEFORE that unit (TU of n−1 units) from the total utility AFTER it (TU of n units): MUn = TUn − TU(n−1). The other liste …
- CBSE 2025Set MARCH1 markMCQQ.Ordinal utility analysis expresses utility in(a) a) Numbers(b) b) Returns(c) c) Ranks(d) d) Ratios
›Reveal solutionSolution
Ordinal utility analysis expresses utility in ranks — option (c).
In the Karnataka 2nd PUC Economics consumer-behaviour chapter, two approaches to utility are studied. Cardinal utility (Marshall) assumes satisfaction can be measured in exact numbers called utils. Ordinal utility (Hicks and Allen, using indifference curves) assumes satisfaction cannot be measured in absolute numbers but can only be ranked — the consumer can say bundle A is preferred to B, or A is better than B, without stating by how many units.
…
- CBSE 2025Set ANNUAL1 markMCQQ.Which of the following is a characteristic of utility? (A) Utility is a psychological phenomenon (B) Utility is subjective (C) Utility is a relative concept (D) All of these
›Reveal solutionSolution
All three listed features — psychological, subjective and relative — describe utility, so the answer is (D) All of these.
In this BSEB Class-12 Economics (Theory of Consumer Behaviour) question, utility means the capacity of a commodity to satisfy a human want. It is a psychological phenomenon because the satisfaction is felt in the mind and cannot be physically measured. It is subjective because the same good yields different utility to different people and even to the same person at different times (a cigarette has utility for a smoker but not for a n …
- CBSE 2025Set ANNUAL1 markMCQQ.Who basically propounded the concept of Law of Equimarginal utility? (A) Marshall (B) Gossen (C) Ricardo (D) Mill
›Reveal solutionSolution
The Law of Equi-marginal Utility is based on Gossen's Second Law, so the concept was basically propounded by Gossen; the answer is (B).
The Law of Equi-marginal Utility (law of substitution / law of maximum satisfaction) states that a consumer gets maximum satisfaction when the ratio of marginal utility to price is equal for all goods bought. This principle is historically Gossen's Second Law — H. H. Gossen first formulated it. Alfred Marshall later refined and popularised it in mo …
🎓Unlock everything free for 14 days
- ✓Full step-by-step solutions
- ✓Concept-first explanations
- ✓Methods, shortcuts & mistakes
- ✓PYQ mapping + timed mock tests
Full access for 14 days. No credit card required.