The molar conductivity of KCl solutions at different concentrations at 298 K are given below:
| / | / |
|---|---|
| 0.000198 | 148.61 |
| 0.000309 | 148.29 |
| 0.000521 | 147.81 |
| 0.000989 | 147.09 |
Show that a plot between and is a straight line. Determine the values of and for KCl.
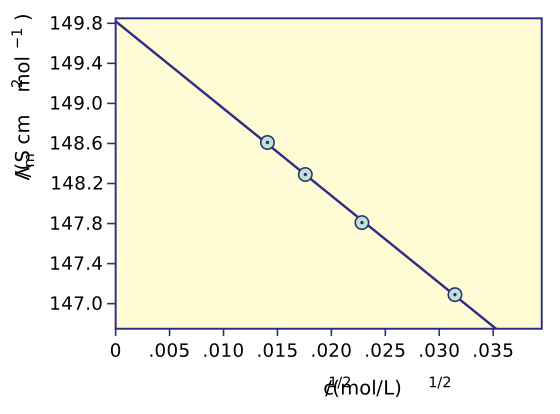
For strong electrolytes like KCl, molar conductivity varies linearly with the square root of concentration (Kohlrausch's law). Plotting vs gives a straight line; the book reads its intercept as and its slope gives .
The key idea here is Kohlrausch's law of independent migration of ions. For strong electrolytes, as you dilute the solution, ions move more freely because interionic attractions weaken. The molar conductivity therefore increases on dilution — and, plotted against the square root of concentration, it decreases linearly as rises. This linear relationship is the hallmark of a strong electrolyte.
Why ? Because the Debye–Hückel theory shows that the ionic atmosphere dragging on a moving ion has a radius proportional to . So the retarding effect scales with , and conductivity rises as falls.
The equation is:
where is the limiting molar conductivity (at infinite dilution) and is a constant for the electrolyte.
Let's test this with the given data.
-
Convert the data to values.
(mol L⁻¹) (mol L⁻¹) (S cm² mol⁻¹) 0.000198 0.01407 148.61 0.000309 0.01758 148.29 0.000521 0.02283 147.81 0.000989 0.03145 147.09 -
Plot against .
The points fall on a straight line: as increases, decreases linearly. This confirms Kohlrausch's law for KCl.
-
Find (slope magnitude).
The slope of the line is :
So .
- Find (the intercept). Extending the straight line to (infinite dilution), NCERT reads the intercept from the graph as:
You don't need to draw the graph perfectly in an exam — just show that the points satisfy a linear relation by computing the slope between successive pairs. If the slopes are nearly constant, the plot is a straight line.
A common mistake is to plot against instead of . That curve is not linear — it bends. Always use for strong electrolytes.
NCERT reads from its graphical extrapolation. If you instead fit the four points algebraically (least squares, or point-slope from the first point: ), you get and — essentially identical to the printed values; the difference is only graphical rounding of the intercept.
The plot of vs is a straight line, giving and for KCl at 298 K.
Unlock everything free for 14 days
- Full step-by-step solutions
- Concept-first explanations
- Methods, shortcuts & mistakes
- PYQ mapping + timed mock tests
Full access for 14 days. No credit card required.