Q.Draw the curve for intensity distribution in diffraction by single slit.
🔒You're viewing a preview — the full solution, concept, methods & PYQ mapping are locked.
🔒 Start your 14-day free trial to unlock the full solution →Concept understanding — Single Slit Diffraction
Single Slit Diffraction: From Intuition to Precision
Imagine you're standing at the edge of a swimming pool and you send a straight wave toward a narrow gap in a wall. If the gap is wide, the wave mostly goes straight through — a clean "shadow" behind the wall. But if the gap is tiny, something strange happens: the wave spreads out in all directions beyond the gap, like ripples from a pebble. That spreading is diffraction.
Light does the same thing. When a parallel beam of light passes through a single narrow slit, it doesn't just make a sharp rectangle on a screen. Instead, you get a pattern: a bright central band, then dark bands (minima), then weaker bright bands (maxima), alternating as you move outward. The narrower the slit, the more the light spreads.
Why does this happen? The core idea
Light from every point across the slit travels to the screen. At any point on the screen, the light arriving from different parts of the slit has travelled different distances. If those path differences are exactly half a wavelength (λ/2), the waves cancel — you get darkness. If they are a whole wavelength (λ), they reinforce — you get a weaker bright band.
The key is that the slit is not a point source. It's a continuous line of sources, each sending out Huygens wavelets. The pattern is the result of interference among all those wavelets.
Common mistake
Students often think diffraction is just "bending around corners." That's part of it, but the real physics is interference between wavelets from different parts of the same slit. Without that interference, there would be no alternating dark and bright bands — just a fuzzy blur.
The precise condition for minima
Let the slit width be a and the wavelength be λ. For a point on a screen far away (the Fraunhofer or far-field condition), light rays from the slit are nearly parallel. The path difference between a wavelet from the top edge and one from the centre is 2asinθ, where θ is the angle from the straight-through direction.
For the first minimum, the wavelets from the top half of the slit cancel those from the bottom half exactly. That happens when the path difference between the two edges is exactly one wavelength:
asinθ=λ
For the second minimum, the slit can be divided into four equal zones, each cancelling the next, giving:
asinθ=2λ
In general, the condition for dark fringes (minima) is:
asinθ=mλfor m=±1,±2,±3,…
Notice m=0 is not a minimum — it's the centre of the bright central maximum.
What about the maxima?
The maxima occur roughly halfway between minima, but their positions are not given by a simple formula like asinθ=(m+21)λ. That formula works for double-slit interference, but for a single slit the maxima are slightly shifted. The exact positions come from solving a calculus problem (the derivative of the intensity function), but for exams you only need the minima condition and the fact that the central maximum is twice as wide as the others.
Quick exam fact
The angular width of the central maximum is 2θ1, where θ1 satisfies asinθ1=λ. So the central maximum spans from −λ/a to +λ/a in sinθ.
The intensity pattern (qualitative) …
The single-slit diffraction intensity pattern shows a very bright, wide central maximum centred at θ = 0, flanked symmetrically by minima (at a sinθ = nλ) and successively fainter secondary maxima whose intensity falls off rapidly on either side. …
The single-slit pattern is a large central bright band with rapidly weakening secondary maxima on either side.
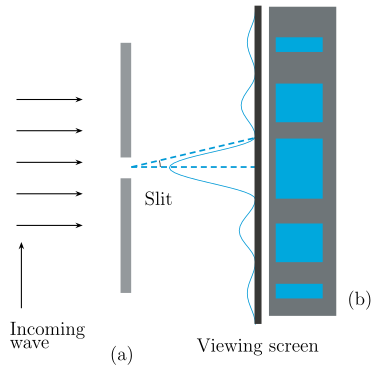
Description of the curve to draw (y-axis: intensity I; x-axis: position on screen, or sinθ):
- A large, bright central maximum centred at θ = 0, containing most of the light. Its intensity is I0.
- On either side, minima occur where asinθ=nλ (n = 1, 2, 3, ...), where a is the slit width. At these points I = 0.
- Between consecutive minima lie secondary maxima, much fainter than the central one. Their intensities fall off rapidly — roughly I0/22, I0/61, ... for the first, second, ... side maxima. …
Showing the 12 most recent of 29 on this concept.
- CBSE 2026Set V11 markQ.The bending of light around the corners and entering into the geometric shadow region is called __________. Fill in the blank choosing the appropriate answer from the bracket: (photons, diffraction, polarity, monopoles, greater than unity, less than unity)
›Reveal solutionSolution
- CBSE 2026Set ANNUAL1 markQ.Read the following passage carefully and answer the questions given below - Light entering in a dark room through a narrow gap under or around a closed door often appears to bend and spread. This is due to diffraction, the narrow gap acts like a slit, and light wave bends around the edges. This phenomenon is a small but clear demonstration of diffraction.(a) What would be the approximate size of sharp edge or opening compared to the wavelength of light for diffraction to be clearly observed?
›Reveal solutionSolution
Diffraction is prominent only when the aperture/obstacle size is comparable to the wavelength of light.
Diffraction effects become clearly noticeable only when the size of the slit/gap or obstacle is of the same order of magnitude as (comparable to) the wavelength of light used. If the opening is much larger than the wavelength, the bending is negligible and light appears to travel in straight lines (ray optics applies); as the opening size approaches the wavelength, diffraction (bending and spreading) becomes prominent — which is why the narrow …
- CBSE 2026Set ANNUAL1 markQ.Read the following passage carefully and answer the questions given below - Light entering in a dark room through a narrow gap under or around a closed door often appears to bend and spread. This is due to diffraction, the narrow gap acts like a slit, and light wave bends around the edges. This phenomenon is a small but clear demonstration of diffraction.(b) Why can the diffraction not be explained by ray-optics?
›Reveal solutionSolution
Ray optics assumes light always travels in straight lines and cannot describe the wave interference behind diffraction.
Ray (geometrical) optics treats light purely as straight-line rays and predicts that an obstacle or slit will simply produce sharp-edged shadows/beams, with no bending at the edges. Diffraction, however, is fundamentally a wave phenomenon — it arises from the superposition (interference) of secondary wavelets originating from different points of the same wavefront as it passes an edge or narrow opening (Huygens–Fresnel principle). Since ray optics ignores the wave nature of …
- CBSE 2026Set ANNUAL1 markQ.Define diffraction of light.
›Reveal solutionSolution
Diffraction is the deviation of light from a straight-line path when it passes an obstacle or a narrow opening whose size is comparable to its wavelength.
Diffraction of light is the phenomenon of bending of light waves around the corners of an obstacle or spreading of light after passing through a narrow slit/aperture, so that light appears in regions that would be a dark geometrical shadow according to simple ray optics. It becomes noticeable when the size of the obstacle/aperture is comparable to the wavelength of light, and is a direct consequence of the wave nature of light (a manifestatio …
- CBSE 2026Set ANNUAL1 markMCQQ.The size of the obstacle for the diffraction of light should be(a) much larger than the wavelength of light(b) much smaller than the wavelength of light(c) of the order of wavelength of light(d) anything can happen
›Reveal solutionSolution
Diffraction (bending of waves around obstacles) is significant only when the obstacle or slit size is comparable to the wavelength - much bigger or much smaller sizes don't show it clearly.
Diffraction is the bending/spreading of waves as they pass an obstacle or through an aperture. This spreading is only prominent when the size of the obstacle/aperture (a) is of the SAME ORDER as the wavelength (lambda) of the wave, i.e. a ~ lambda. If the obstacle is much LARGER than the wavelength, the wave essentially travels in straight lines (geometrical shadow, negligible diffraction) - this is why we don't see visible light (wavelength ~500 nm) diffracting around everyday-s …
- CBSE 2026Set ANNUAL1 markQ.What do you understand by the term 'diffraction of light'?
›Reveal solutionSolution
Diffraction is the bending of light into the region that geometrical (ray) optics would call 'shadow' when it passes an obstacle or aperture.
According to simple ray/geometrical optics, light travelling past an obstacle or through a slit should produce a sharp-edged shadow. In reality, being a wave, light bends slightly around the edges of the obstacle/aperture and spreads into what would otherwise be the shadow region, producing a pattern of bright and dark fringes near the edges. This bending and spreading of light waves around obstacles/apertures is called diffraction. It becomes prominent only when the size of the obstacle or aperture is comparable to the wavelength of light, …
- CBSE 2026Set ANNUAL1 markMCQQ.Select the correct option with respect to the figures given below:(a) Fig.(i) depicts diffraction pattern and Fig.(ii) depicts interference pattern(b) Both depict interference pattern(c) Both depict diffraction pattern(d) Fig.(i) depicts an interference pattern due to a double-slit and Fig.(ii) depicts a diffraction pattern due to a single-slit
›Reveal solutionSolution
The key distinguishing feature between interference and diffraction intensity patterns is the relative heights of the fringes: interference from two narrow slits gives many fringes of roughly equal intensity, while diffraction from a single slit gives one strong central maximum with much weaker, rapidly falling secondary maxima.
Distinguishing interference from diffraction patterns
In Young's double-slit interference experiment, two coherent narrow sources produce a pattern of bright and dark fringes on the screen. Because the two slits are treated as (nearly) point/line sources of equal amplitude, the resulting bright fringes are all of comparable/roughly equal intensity across the region observed (there is a slowly-varying diffraction "envelope" from each slit's own finite width, but for the idealised interference pattern, the fringes near the centre appear as a series of similar-height peaks, evenly spaced by the fringe width β=λD/d).
In single-slit diffraction, light passing through one slit produces a pattern with:
- one very bright central maximum (roughly twice as wide as the secondary maxima), and
- a series of much fainter secondary maxima on either side, whose intensities fall off rapidly (roughly as 1/m2 or faster) with distance from the centre.
Applying this to the two figures
…
- CBSE 2026Set ANNUAL1 markQ.Write True or False: The energy redistribution takes place in phenomenon of diffraction.
›Reveal solutionSolution
True — diffraction redistributes light energy from minima to maxima; total energy is conserved.
Diffraction (like interference) does not create or destroy energy. Where destructive interference produces dark fringes (minima), the energy that would have arrived there is redistributed to the bright fringes (maxima), where constructive interference occurs. The average energy over the w …
- CBSE 2025Set 55/4/11 markMCQQ.Assertion (A): In a double slit experiment, if one slit is closed, the diffraction pattern due to the other slit will appear on the screen. Reason (R): For interference, at least two waves are required. (A) Both Assertion (A) and Reason (R) are true and Reason (R) is the correct explanation of the Assertion (A). (B) Both Assertion (A) and Reason (R) are true, but Reason (R) is not the correct explanation of the Assertion (A). (C) Assertion (A) is true, but Reason (R) is false. (D) Both Assertion (A) and Reason (R) are false.
›Reveal solutionSolution
The assertion is true — closing one slit leaves a single-slit diffraction pattern — and the reason is also true, because interference requires two coherent waves. But the reason does not explain the assertion; it merely states a necessary condition for interference, not why a single slit produces diffraction. So both are true, but (R) is not the correct explanation of (A). The correct option is (B).
Let’s unpack this carefully. The question tests your understanding of two distinct phenomena: diffraction and interference, and how they relate in a double-slit experiment.
1. What happens when both slits are open?
In the classic Young’s double-slit experiment, light from a single source passes through two narrow slits. Each slit acts as a coherent secondary source (Huygens’ principle). The waves from the two slits overlap on the screen and interfere — producing alternating bright and dark fringes (interference pattern). But that’s not the whole story.
Each slit individually also diffracts the light — because the slit width is comparable to the wavelength. So the actual pattern on the screen is a combination: a broad single-slit diffraction envelope modulating the sharp double-slit interference fringes.
The intensity in a double-slit experiment is:
I(θ)=I0(βsinβ)2cos2α
where β=λπasinθ (diffraction factor, a = slit width) and α=λπdsinθ (interference factor, d = slit separation).
2. Assertion (A): If one slit is closed, the diffraction pattern due to the other slit will appear.
Yes — this is true. When you block one slit, you are left with a single slit of width a. Light passing through that single slit spreads out due to diffraction. The pattern on the screen is a central bright maximum flanked by weaker, narrower secondary maxima — the classic single-slit diffraction pattern.
NoteThe single-slit diffraction pattern is given by I(θ)=I0(βsinβ)2, where β=λπasinθ. The first minimum occurs at sinθ=λ/a.
So the assertion is correct.
3. Reason (R): For interference, at least two waves are required.
This is also true. Interference is the superposition of two or more coherent waves. With one slit, you have only one wavefront emerging — so no interference between two separate sources. You get diffraction, not interference. …
- CBSE 2025Set ANNUAL1 markQ.Draw the diagram of intensity distribution of fringes due to diffraction at a single slit.
›Reveal solutionSolution
Figure — Stem asks to draw the intensity distribution of single-slit diffraction fringes; the catalog 'Intensity distri Single-slit diffraction produces one broad, intense central maximum, flanked on both sides by progressively weaker secondary maxima separated by zero-intensity minima.
A hand-drawn figure cannot be rendered in this text answer, so the pattern is described precisely instead:
- Plot intensity I (vertical axis) against position/angle θ (horizontal axis), symmetric about θ=0.
- At the centre (θ=0) there is a broad central maximum of intensity I0 — this is both the tallest and (angularly) the widest peak, twice the angular width of any secondary maximum.
- On either side, intensity falls to zero at the first minima, located at sinθ=±λ/a (where a is the slit width). …
- CBSE 2025Set ANNUAL1 markQ.Define 'diffraction of light'.
›Reveal solutionSolution
Diffraction is a wave phenomenon in which light spreads out and bends around corners/edges or through small openings, producing a pattern of bright and dark fringes rather than a sharp geometrical shadow.
When a wave encounters an obstacle or aperture whose size is comparable to its wavelength, it does not travel in a perfectly straight line past the obstacle - instead it bends and spreads into the region that a strictly rectilinear ray would treat as "shadow". This bending and spreading is called diffraction.
…
- CBSE 2025Set ANNUAL1 markQ.Diffraction of light is the phenomenon of bending of light around the corners of an aperture in its path. (T/F)
›Reveal solutionSolution
This statement is True — diffraction is indeed the bending of light waves around obstacles or edges of an aperture.
Diffraction is the phenomenon in which a wave spreads out and bends as it passes through a narrow aperture or around the edge of an obstacle whose size is comparable to the wavelength of light. This bending is not due to reflection or refraction but is a direct consequence of the …
🎓Unlock everything free for 14 days
- ✓Full step-by-step solutions
- ✓Concept-first explanations
- ✓Methods, shortcuts & mistakes
- ✓PYQ mapping + timed mock tests
Full access for 14 days. No credit card required.