Economics · Ch 3 — Organisation of Data
Introduction
Introduction
Once data have been collected — whether by census or by sampling — the next step is to organise them. Freshly gathered data are usually raw: disorganised, often very large, and cumbersome to handle. Drawing any meaningful conclusion from such a mass of unordered figures is a tedious, almost impossible task, because raw data do not yield to statistical methods easily. The purpose of classifying raw data is therefore to bring order into them, so that they can be subjected to further analysis with ease.
A familiar analogy makes the idea clear. Think of the local kabadiwallah (junk dealer) who buys old newspapers, bottles, plastics and scrap metal. If he simply piled everything together, he could never manage his trade or find what a buyer wants. Instead he groups his junk — newspapers tied together, glass bottles in a sack, metals sorted into "iron", "copper", "aluminium", "brass" — and by doing so brings order to the heap and can locate any item quickly.
Drawn by us to help you understand the concept clearly, and verified to make sure it's accurate. For exams, practice from your NCERT textbook's own diagram.
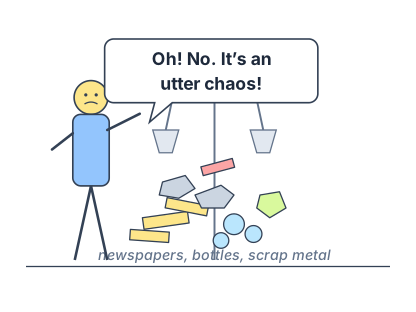
Own-drawn recreation of the NCERT cartoon (p.23): the kabadiwallah (junk dealer) looks at his disorganised junk — newspapers, bottles and scrap metal all piled together around his weighing-scale frame — and exclaims "Oh! No. It's an utter chaos!". It dramatises the chapter's opening point that raw, unclassified data (like unsorted junk) is hard to manage until it is grouped into classes. Scene and caption are the book's own facts, reproduced from a fact-checklist (person, weighing-scale frame, an unsorted mixed pile, the exact quoted speech-bubble line); the artwork itself is drawn by us, not traced from NCERT.
Arranging your schoolbooks subject-wise works the same way — to find a history book you look only inside the "History" group.
Two points follow. First, classification saves time and effort. Second, it is never arbitrary — things are grouped according to a sensible criterion. Classification can thus be defined as arranging things into groups or classes on the basis of some criterion.
Why this matters for data is easy to see. If you list the mathematics marks of 100 students with no order, then to find the highest mark or the average you must first sort the entire list — a chore that becomes far worse with 1,000 or 5,000 records, and effectively impossible for the Census of India's returns on crores of people. Only when the values are grouped into classes, and each class is given its frequency (the count of observations falling inside it), does the structure become readable. This grouped summary is the frequency distribution table the chapter builds toward.
Building it brings in a little arithmetic that the next chapters lean on heavily. Each class runs from a lower limit to an upper limit ; the class width (class interval) is simply , the span the class covers, while the single value that stands in for the whole class — its class mark or mid-value — is the average of the two limits:
This mid-value represents every observation inside the class when we later compute averages and dispersion, so a class 20–30 is represented by and has a width of .
Studying this chapter should enable you to:
- classify data for further statistical analysis;
- distinguish quantitative from qualitative classification (and recognise chronological and spatial types);
- prepare a frequency distribution table;
- form classes — class limits, class interval, class mark, inclusive and exclusive methods;
- use the technique of tally marking; and
- tell univariate from bivariate frequency distributions.
In short, organising raw data through classification — and especially through a frequency distribution, with its class limits, its class width and its class mark — is what turns an unmanageable heap of numbers into a concise form ready for analysis. Exactly how such a distribution is built from raw data is taken up in the sections that follow.
Activity
Visit your local post-office to find out how letters are sorted. Do you know what the PIN code in a letter indicates? Ask your postman.