Physics · Ch 10 — Thermal Properties of Matter
Ideal-gas Equation and Absolute Temperature
Ideal-gas Equation and Absolute Temperature
The Ideal-Gas Equation and Absolute Temperature
The behaviour of gases under varying conditions of pressure, volume, and temperature has been studied for centuries. Early experiments by Boyle, Charles, and Gay-Lussac revealed simple proportional relationships — but these laws only held when the gas was kept at a fixed condition. The real power comes when we combine them into a single equation that describes the state of an ideal gas.
The Three Gas Laws as Building Blocks
Before we combine them, recall the three fundamental experimental laws that govern a fixed mass of gas:
Boyle's Law (at constant temperature):
or
Charles's Law (at constant pressure):
or
Gay-Lussac's Law (at constant volume):
or
Each of these laws holds only when the third variable is held fixed. But in nature, all three change simultaneously. We need a single relation that connects , , and for a given mass of gas.
Combining the Laws: The Derivation
Consider a fixed mass of gas initially at pressure , volume , and absolute temperature . We want to find the final state .
We can do this in two steps:
Step 1: Change the temperature from to while keeping the pressure constant at . By Charles's law:
Step 2: Now change the pressure from to while keeping the temperature constant at . By Boyle's law:
Substituting from Step 1:
Rearranging:
Since the initial and final states are arbitrary, the quantity must be constant for a fixed mass of gas. This is the combined gas law:
This constant depends on two things: the amount of gas (how many molecules) and the nature of the gas itself. For different gases, the constant is different — unless we use the mole as our measure of amount.
Introducing the Mole and the Universal Constant
The constant in is proportional to the number of moles of the gas. The proportionality constant is the same for all gases — this is the universal gas constant . Thus:
Or, in its most familiar form:
This is the ideal-gas equation (also called the ideal-gas law).
Where:
- = pressure of the gas (in pascals, Pa)
- = volume of the gas (in cubic metres, m)
- = number of moles of the gas
- = universal gas constant = 8.31 J mol K
- = absolute temperature (in kelvin, K)
The temperature in the ideal-gas equation must be in kelvin. Using Celsius will give a completely wrong result. Always convert: .
The Value of R
The universal gas constant has the same value for all gases, regardless of their chemical identity — this universality is exactly what makes it possible to write one single equation of state, , that applies to any ideal gas. Its value is:
This is the value used throughout this chapter and in most numerical problems involving gases.
Absolute Temperature: The Kelvin Scale
The ideal-gas equation reveals something profound about temperature. If we cool a gas at constant pressure, its volume decreases linearly with temperature — but only until a point. Extrapolating the vs graph backwards, the volume would become zero at C. This is absolute zero — the lowest possible temperature.
The absolute temperature scale (kelvin scale) is defined with its zero at this point:
On this scale, the ideal-gas equation takes its simple linear form . The kelvin is the SI unit of thermodynamic temperature, and one kelvin is exactly of the thermodynamic temperature of the triple point of water.
| Scale | Freezing point of water | Boiling point of water | Absolute zero | …
Drawn by us to help you understand the concept clearly, and verified to make sure it's accurate. For exams, practice from your NCERT textbook's own diagram.
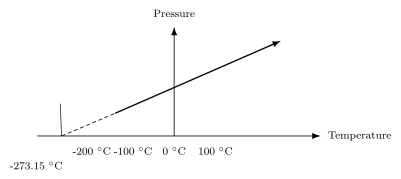
The figure plots pressure on the vertical axis against temperature in degrees Celsius on the horizontal axis. The horizontal scale runs from about to , with tick marks at , , , and . A single straight line rises from left to right, showing that pressure increases linearly with temperature when the gas is held at constant volume. The line is drawn as a solid curve only over the range where actual measurements exist — roughly from upward. Below that, a dashed straight line extends the same linear trend backward, crossing the temperature axis at . At that point the pressure would be zero.
The physical idea is simple but profound: for a fixed amount of gas trapped in a rigid container, the pressure is directly proportional to the Celsius temperature, but only if you shift the zero point. The straight line tells you that and are related by
where is the pressure at . This is the pressure law for a constant-volume gas thermometer. The dashed extrapolation to at reveals the absolute zero of temperature — the coldest possible temperature, where the kinetic energy of gas molecules would vanish.
The figure is the experimental foundation for the absolute (Kelvin) temperature scale. Define , and the pressure law becomes the beautifully simple proportionality (at constant volume and fixed amount of gas).
The textbook uses this figure to motivate the ideal-gas equation. Combining the pressure law with Charles’s law (volume proportional to absolute temperature at constant pressure) and Avogadro’s law (volume proportional to amount of gas at fixed and ) gives the single relation
…
Drawn by us to help you understand the concept clearly, and verified to make sure it's accurate. For exams, practice from your NCERT textbook's own diagram.
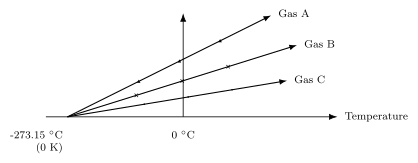
The figure plots pressure on the vertical axis against temperature on the horizontal axis. Three straight lines are drawn, each labelled for a different gas — Gas A, Gas B, and Gas C. Each line is obtained by measuring the pressure of a fixed mass of that gas at constant volume, as the temperature is varied. The measured points lie on a straight line for each gas, confirming that pressure and temperature are linearly related when volume is fixed.
The key feature is that all three lines, when extended backwards (the dashed extrapolations), meet at a single point on the temperature axis. That point is at . This is the same temperature for every gas, regardless of its identity or the amount of gas used. The extrapolation tells us that if a gas could be cooled to this temperature, its pressure would become zero — an absolute lower limit of temperature.
The common intersection point at defines absolute zero on the Kelvin scale: .
The physical idea is that temperature is not merely a relative measure of hotness; it has a natural zero. The straight-line behaviour of pressure with temperature at constant volume is expressed by the relation
where is the absolute temperature in kelvin. More precisely, for a fixed mass of gas at constant volume,
If you know the pressure at temperature , you can find the pressure at another temperature using
This is a special case of the ideal-gas law. The figure makes it clear that the proportionality constant depends on the gas (the slopes differ), but the zero-point is universal.
Do not confuse the extrapolated zero-pressure point with reality. Real gases liquefy before reaching absolute zero; the straight-line behaviour breaks down at very low temperatures. The extrapolation is a theoretical limit, not an experimental observation. …
Drawn by us to help you understand the concept clearly, and verified to make sure it's accurate. For exams, practice from your NCERT textbook's own diagram.
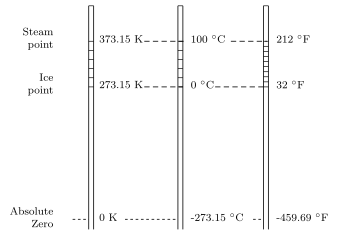
The figure places three vertical thermometric scales side by side: Kelvin on the left, Celsius in the middle, Fahrenheit on the right. Each scale is a straight line with tick marks, and the three are aligned so that the same physical temperature sits at the same height on all three. Dashed horizontal lines connect three key fixed points across the scales.
At the top, the steam point (boiling water at standard atmospheric pressure) is marked at 373.15 K, 100 °C, and 212 °F. In the middle, the ice point (melting ice) is at 273.15 K, 0 °C, and 32 °F. At the bottom, absolute zero — the lowest possible temperature — is at 0 K, –273.15 °C, and –459.69 °F.
The physical idea is that temperature is a continuous, one-dimensional quantity, and these three scales are just different rulers for measuring it. The Kelvin scale is an absolute scale starting at zero, while Celsius and Fahrenheit are relative scales with arbitrary zeros. The dashed lines show that the same physical state (ice melting, water boiling, or the zero‑energy limit) corresponds to different numbers on different rulers.
The textbook uses this figure to develop the conversion formulas between the scales. Because the spacing between the ice point and the steam point is 100 divisions on the Kelvin and Celsius scales but 180 divisions on the Fahrenheit scale, the relationship is linear. For a temperature in kelvin, in degrees Celsius, and in degrees Fahrenheit:
Here is the absolute temperature in kelvin, is the Celsius temperature, and is the Fahrenheit temperature. The factor comes from the ratio of the scale lengths: 100 °C spans the same physical interval as 180 °F, so one Celsius degree equals Fahrenheit degrees. The offset of 32 accounts for the fact that the Fahrenheit zero is 32 degrees below the ice point.
A common mistake is to write instead of . For most exam problems the difference is negligible, but the exact value is 273.15. The figure shows this precisely: the ice point is 273.15 K, not 273 K. …