Applied Mathematics · Ch 8 — Index Numbers and Time-based Data
Trend Analysis by Fitting Linear Trend Line
Trend Analysis by Fitting Linear Trend Line
Of the four components that make up a time series, the secular trend is usually of the greatest practical interest, since it captures the long-term direction the series is actually heading in — the signal that forecasting most depends on. Several methods exist to extract this trend from raw data: the graphical method, the semi-averages method, the moving-averages method, and the method of least squares. This chapter works through the two most commonly used in practice — the moving average method, which smooths out short-term noise to reveal the underlying movement, and the method of least squares, which fits the best …
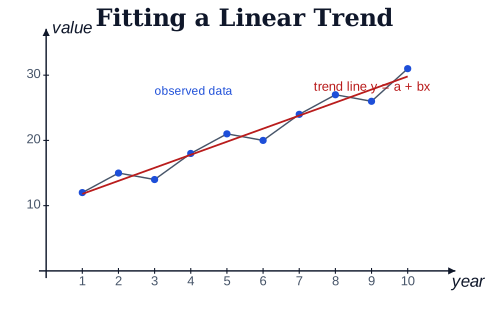
Drawn by us to help you understand the concept clearly, and verified to make sure it's accurate. For exams, practice from your NCERT textbook's own diagram.
The least-squares straight-line trend y = a + bx summarises the long-term direction o …