Mathematics · Ch 7 — Applications of Differential Calculus
Extrema using Second Derivative Test
Extrema using Second Derivative Test
The Second Derivative Test relates critical points, extreme values, and concavity into a single practical tool for classifying whether a critical point is a relative minimum or maximum.
Theorem 7.13 (The Second Derivative Test). Suppose is a critical point at which , exists in a neighborhood of , and exists. Then has:
- a relative maximum value at if ;
- a relative minimum value at if ;
- no information from this test if — the test is inconclusive, and the classification must fall back on the First Derivative Test (§7.6.4) instead.
Worked pattern (as in Examples 7.59–7.61). Find the critical numbers by solving ; compute and evaluate it at each critical number; apply the sign rule above to classify each one, falling back to a sign table of wherever . …
![Fig. 7.25 — Graph of y = 3 + sin x over [-2pi, 2pi]: a periodic curve, concave upward on (-pi,0) and concave downward on (0,pi), with a point of inflection at (0,3); range values from 2 to 4.](/figures/applications-of-differential-calculus/three-plus-sin-x-concavity-fig-7-25.svg)
Drawn by us to help you understand the concept clearly, and verified to make sure it's accurate. For exams, practice from your textbook's own diagram.
What this figure shows. Graph of y = 3 + sin x over [-2pi, 2pi]: a periodic curve, concave upward on (-pi,0) and concave downward on (0,pi), with a point of inflection at (0,3); range va …
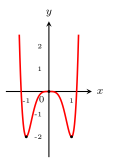
Drawn by us to help you understand the concept clearly, and verified to make sure it's accurate. For exams, practice from your textbook's own diagram.
What this figure shows. Graph of f(x) = 4x^6 - 6x^4: a symmetric double-well curve with local minima at (-1,-2) and (1,-2) and a local maximum at the or …