Economics · Ch 16 — Measures of Dispersion
Lorenz Curve
Lorenz Curve
All the measures discussed so far give a numerical value of dispersion. The Lorenz Curve is a graphical measure, used especially for estimating inequalities in a distribution — most familiarly, income inequality. You may have heard statements such as 'the top 10% of the people earn 50% of the national income, while the top 20% account for 80%': the Lorenz curve turns exactly this kind of cumulative information into a picture. A Lorenz curve of income shows the relationship between the cumulative percentage of population and its cumulative share of income, and is especially useful for comparing the variability of two or more distributions by drawing their curves on the same axes.
Construction of the Lorenz curve
Consider the monthly incomes of the employees of a company. The working table is built as follows: (1) find the class mid-points ; (2) estimate the total income of each class by multiplying its mid-point by its frequency ; (3) express each class frequency as a percentage of the total frequency; (4) express each class's total income as a percentage of the grand total income; (5) form the 'less than' cumulative frequency and cumulative income; (6) draw the line of equal distribution by joining the co-ordinate to ; and (7) plot the cumulative percentage of employees on the horizontal axis against the cumulative percentage of income on the vertical axis, and join the points to get the Lorenz curve.
Table 6.4 — Monthly incomes of employees
| Income class (₹) | Mid-point (X) | Frequency (f) | Total income of class (FX) | % of frequency | % of total income |
|---|---|---|---|---|---|
| 0–5000 | 2,500 | 5 | 12,500 | 10 | 1.29 |
| 5000–10000 | 7,500 | 10 | 75,000 | 20 | 7.71 |
| 10000–20000 | 15,000 | 18 | 2,70,000 | 36 | 27.76 |
| 20000–40000 | 30,000 | 10 | 3,00,000 | 20 | 30.85 |
| 40000–50000 | 45,000 | 7 | 3,15,000 | 14 | 32.39 |
| Total | 50 | 9,72,500 | 100 |
Table 6.5 — 'Less than' cumulative frequency and income
| 'Less than' (₹) | Cumulative frequency (%) | Cumulative income (%) |
|---|---|---|
| 5,000 | 10 | 1.29 |
| 10,000 | 30 | 9.00 |
| 20,000 | 66 | 36.76 |
| 40,000 | 86 | 67.61 |
| 50,000 | 100 | 100.00 |
Studying the Lorenz curve …
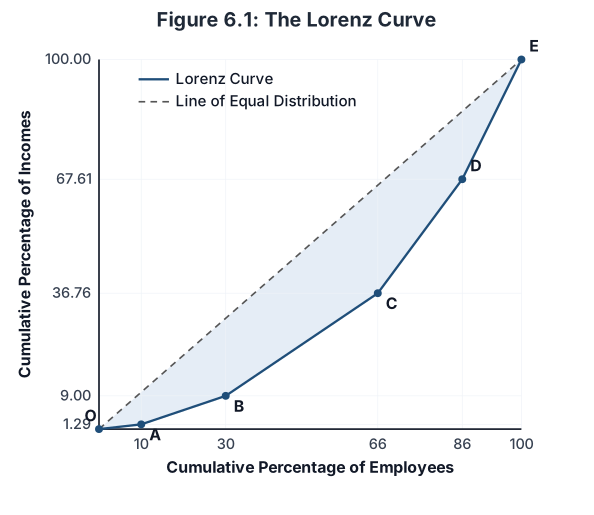
Drawn by us to help you understand the concept clearly, and verified to make sure it's accurate. For exams, practice from your textbook's own diagram.
Own recreation of the Lorenz curve from the worked data (Tables 6.4 and 6.5 above). The straight dashed diagonal OE is the line of equal distribution (every share of people earns an equal share of income). The bowed curve through O, A, B, C, D, E is the actual distribution: the farther it lies below OE, the greater the inequality. The shaded gap bet …