Informatics Practices · Ch 3 — Data Handling using Pandas – II
GROUP BY Functions
GROUP BY Functions
The groupby() function in Pandas is used to split a DataFrame into groups based on some criterion — typically the values in one or more columns. This is not just a way to rearrange data; it is the foundation for performing separate calculations on each group.
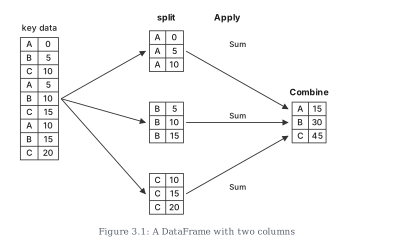
The function works on a split-apply-combine strategy, which happens in three clear steps:
- Split the original DataFrame into groups by creating a GroupBy object.
- Apply the required function (like sum, mean, or a custom function) to each group independently.
- Combine the results into a new DataFrame or Series.
To see this in action, imagine a simple two-column DataFrame: one column called key (with values A, B, C) and another called data. If you want the sum of data for each key, you first split the rows into three groups (all A rows together, all B rows together, all C rows together). Then you apply the sum function to each group. Finally, you combine the three sums into a new DataFrame showing A: 15, B: 30, C: 45 (as in the textbook's Figure 3.1).
Creating a GroupBy Object
You create a GroupBy object by calling df.groupby('column_name'). This does not compute anything yet — it just stores the grouping information.
g1 = df.groupby('Name')
Once you have this object, you can inspect the groups in several ways:
g1.first()— displays the first row from each group. For the textbook's DataFramedf, this shows each student's first UT scores.g1.size()— returns the number of rows in each group. All four students (Ashravy, Mishti, Raman, Zuhaire) have 3 rows each.g1.groups— a dictionary where keys are group names and values are the row indices belonging to that group. For example,'Ashravy': Int64Index([6, 7, 8], dtype='int64')means rows 6, 7, and 8 belong to Ashravy.g1.get_group('Raman')— extracts the entire DataFrame for a single group. This returns all rows whereNameis 'Raman'.
Grouping by Multiple Columns
You can group by more than one column by passing a list of column names:
g2 = df.groupby(['Name', 'UT'])
This creates groups for each unique combination of student and unit test. Calling g2.first() shows the first occurrence of each combination — effectively a multi-indexed view of the data.
Aggregation: Applying Functions to Groups
Once groups are created, the next step is to apply functions. This is called aggregation — it returns a single aggregated value (like mean, sum, or standard deviation) for each group.
Aggregation is done using the agg() or aggregate() function. By default, functions are applied column-wise.
Example 1: Average marks scored by all students in each subject for each UT.
df.groupby(['UT']).aggregate('mean')
This produces a table with UT numbers as rows and subjects as columns, each cell containing the average marks for that UT.
Example 2: Average marks in Maths for each UT.
group1 = df.groupby(['UT'])
group1['Maths'].aggregate('mean')
Here, you first create the GroupBy object, then select only the Maths column before applying the mean. The result is a Series with UT numbers as the index.
Applying Multiple Aggregate Functions
You can apply several different functions at once by passing a list of function names to agg().
Program 3-10 from the textbook demonstrates this: to print the mean, variance, standard deviation, and quartile of Maths marks for each student across all UTs.
df.groupby(by='Name')['Maths'].agg(['mean', 'var', 'std', 'quantile'])
The output is a DataFrame where each row is a student and each column is one of the requested statistics. For example, Ashravy has a mean of 19.67, variance 44.33, standard deviation 6.66, and quartile 23.0. …
Drawn by us to help you understand the concept clearly, and verified to make sure it's accurate. For exams, practice from your textbook's own diagram.
The figure is a schematic that walks through the three steps of the split-apply-combine strategy for a GROUP BY operation. It uses a simple two-column DataFrame as a concrete example.
On the far left, you see the original DataFrame. It has two columns labelled 'key' and 'data'. There are nine rows. The 'key' column contains the values A, B, and C repeated in that order three times: A, B, C, A, B, C, A, B, C. The corresponding 'data' column holds the numbers 0, 5, 10, 5, 10, 15, 10, 15, 20. So the pairs are (A,0), (B,5), (C,10), (A,5), (B,10), (C,15), (A,10), (B,15), (C,20).
An arrow labelled 'split' points from this DataFrame to the middle section. The split step separates the nine rows into three distinct groups based on the 'key' column. Each group is shown as its own mini-DataFrame. Group A contains the three rows where key is A, with data values 0, 5, and 10. Group B contains the rows with key B, data values 5, 10, and 15. Group C contains the rows with key C, data values 10, 15, and 20.
Next, an arrow labelled 'Apply' leads from each group to a box that says 'Sum'. This is the apply step: the sum function is applied to the 'data' column within each group. For group A, the sum is 0+5+10 = 15. For group B, it is 5+10+15 = 30. For group C, it is 10+15+20 = 45.
Finally, an arrow labelled 'Combine' takes those three results and assembles them into a new, smaller DataFrame on the far right. This result DataFrame has two columns again: 'key' and 'data'. It has three rows: A with data 15, B with data 30, and C with data 45. …
| Name | UT | Maths | Science | S.St | Hindi | Eng |
|---|---|---|---|---|---|---|
| Ashravy | 1 | 23 | 19 | 20 | 15 | 22 |
| Mishti | 1 | 15 | 22 | 25 | 22 | 22 |
| Raman | 1 | 22 | 21 | 18 | 20 | 21 |
| Name | Size |
|---|---|
| Ashravy | 3 |
| Mishti | 3 |
| Raman | 3 |
| Index | UT | Maths | Science | S.St | Hindi | Eng |
|---|---|---|---|---|---|---|
| 0 | 1 | 22 | 21 | 18 | 20 | 21 |
| 1 | 2 | 21 | 20 | 17 | 22 | 24 |
| Name | UT | Maths | Science | S.St | Hindi | Eng |
|---|---|---|---|---|---|---|
| Ashravy | 1 | 23 | 19 | 20 | 15 | 22 |
| Ashravy | 2 | 24 | 22 | 24 | 17 | 21 |
| Ashravy | 3 | 12 | 25 | 19 | 21 | 23 |
| Mishti | 1 | 15 | 22 | 25 | 22 | 22 |
| Mishti | 2 | 18 | 21 | 25 | 24 | 23 |
| Mishti | 3 | 17 | 18 | 20 | 25 | 20 |
| Raman | 1 | 22 | 21 | 18 | 20 | 21 |
| Raman | 2 | 21 | 20 | 17 | 22 | 24 |
| Raman | 3 | 14 | 19 | 15 | 24 | 23 |
| Zuhaire | 1 | 20 | 17 | 22 | 24 | 19 |
| Zuhaire | 2 | 23 | 15 | 21 | 25 | 15 |
| UT | Maths | Science | S.St | Hindi | Eng |
|---|---|---|---|---|---|
| 1 | 20.00 | 19.75 | 21.25 | 20.25 | 21.00 |
| 2 | 21.50 | 19.50 | 21.75 | 22.00 | 20.75 |
| UT | Mean Maths |
|---|---|
| 1 | 20.00 |
| 2 | 21.50 |
| 3 | 16.25 |
Write the python statements to print the mean, variance, standard deviation and quartile of the marks scored in Mathematics by each student across the UTs. This chains GROUP BY() with agg() to compute four differe …