Chemistry · Ch 4 — The d- and f-Block Elements
Physical Properties
Physical Properties
Metallic Character
Almost every transition element behaves as a classic metal: good tensile strength, ductility, malleability, high thermal and electrical conductivity, and a metallic lustre. Most of them also crystallise in one or more of the standard close-packed metallic lattices (body-centred cubic, hexagonal close-packed, or cubic close-packed) at ordinary temperatures — the lattice-structure data for the full 3/4/5 set is collected in the accompanying table. The exceptions are Zn, Cd, Hg and Mn, which adopt structures that are not among the three typical metallic arrangements.
Lattice Structures of Transition Metals
| Sc | Ti | V | Cr | Mn | Fe | Co | Ni | Cu | Zn |
|---|---|---|---|---|---|---|---|---|---|
| hcp (bcc) | hcp (bcc) | bcc | bcc | X (bcc, ccp) | bcc (hcp) | ccp (hcp) | ccp | ccp | X (hcp) |
| Y | Zr | Nb | Mo | Tc | Ru | Rh | Pd | Ag | Cd |
|---|---|---|---|---|---|---|---|---|---|
| hcp (bcc) | hcp (bcc) | bcc | bcc | hcp | hcp | ccp | ccp | ccp | X (hcp) |
| La | Hf | Ta | W | Re | Os | Ir | Pt | Au | Hg |
|---|---|---|---|---|---|---|---|---|---|
| hcp (ccp,bcc) | hcp (bcc) | bcc | bcc | hcp | hcp | ccp | ccp | ccp | X |
High Melting and Boiling Points
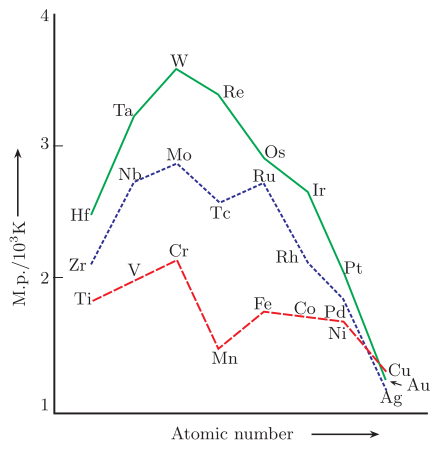
With the exception of Zn, Cd and Hg, transition metals are hard and have very low volatility, which shows up as unusually high melting and boiling points. The reason lies in the bonding: in a normal metal, only the outermost electrons participate in metallic bonding, but in a transition metal the electrons join in as well. Because a greater number of electrons — both and — take part in holding the lattice together, the interatomic metallic bonding is markedly stronger, and correspondingly more energy is needed to break the lattice apart.
Drawn by us to help you understand the concept clearly, and verified to make sure it's accurate. For exams, practice from your textbook's own diagram.
What the Graph Shows
The figure plots melting point (in units of K) on the vertical axis against atomic number on the horizontal axis. Three separate curves are drawn, one for each transition series:
- 3d series: Sc Ti V Cr Mn Fe Co Ni Cu Zn
- 4d series: Y Zr Nb Mo Tc Ru Rh Pd Ag Cd
- 5d series: La Hf Ta W Re Os Ir Pt Au Hg
Each point on a curve is labelled with the element symbol. The curves are not continuous lines but connect the points for each series, showing how melting point changes as you move across the period.
What the Pattern Teaches
All three curves share a common shape: they rise to a maximum near the middle of the series (at Cr, Mo, and W respectively — the configuration region) and then fall towards the end. A notable dip occurs at Mn (3d series) and Tc (4d series); the 5d series shows a similar but less pronounced dip at Re.
The 5d series lies highest overall, the 4d series is intermediate, and the 3d series is lowest. This ordering reflects the increasing strength of metallic bonding as you go down a group: more diffuse orbitals in heavier elements allow greater overlap and stronger bonding.
The Physical Idea
Melting point in transition metals is determined by the strength of metallic bonding, which depends on the number of unpaired electrons available for bonding. In the middle of a series (around ), the maximum number of unpaired electrons gives the strongest bonding and highest melting point. At the ends (early – or late –), fewer unpaired electrons weaken the bond, lowering the melting point. The dip at Mn/Tc arises because the half-filled subshell is stable and less willing to share electrons, temporarily reducing bond strength.
Key Formula Developed
The textbook uses this figure to introduce the concept of enthalpy of atomisation (), which is the energy required to convert one mole of a solid metal into isolated gaseous atoms. For transition metals, is directly related to the melting point trend:
…
Within any one row (3, 4 or 5), melting point rises to a maximum around the configuration and then falls off fairly steadily as the atomic number increases further — Mn and Tc are the anomalies that break this pattern. This maximum at (or near) is consistent with the idea that having one unpaired electron in each of the five orbitals is especially favourable for strong interatomic interaction: the more valence electrons available for bonding, the stronger the resulting bond.
Enthalpy of Atomisation
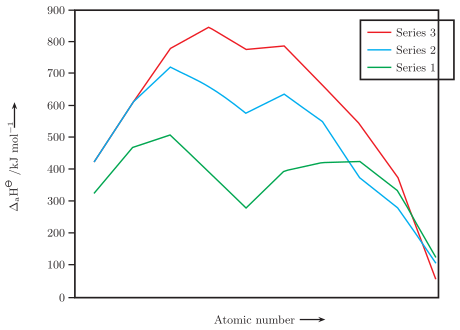
The same underlying trend is reflected in the enthalpy of atomisation, which also peaks near the middle of each series before declining. Two further generalisations emerge on comparing the three series:
- Because enthalpy of atomisation is a major factor governing a metal's standard electrode potential, metals with a very high enthalpy of atomisation (equivalently, a very high boiling point) tend to be relatively unreactive — "noble" — in their chemical behaviour.
- The 4 and 5 series metals have distinctly greater enthalpies of atomisation than the corresponding 3 metals. This greater strength of metal–metal bonding in the heavier series is an important reason why metal–metal bonded compounds occur much more frequently among the heavier transition metals.
Drawn by us to help you understand the concept clearly, and verified to make sure it's accurate. For exams, practice from your textbook's own diagram.
The figure is a line graph plotting enthalpy of atomisation (, in ) on the vertical axis against atomic number (Z) on the horizontal axis. Three separate curves are drawn, one for each transition series:
- 3d series (Sc to Zn, atomic numbers 21–30)
- 4d series (Y to Cd, atomic numbers 39–48)
- 5d series (La to Hg, atomic numbers 57–80, excluding the lanthanides)
Each curve has nine data points (one per element) connected by a line. The y‑axis runs from 0 to 900 in steps of 100. All three curves show a common pattern: they rise from the left, reach a maximum near the middle of the series, and then fall toward the right end. The 5d series lies highest throughout, the 4d series is intermediate, and the 3d series is lowest.
What the figure teaches
The enthalpy of atomisation is the energy required to convert one mole of a solid metal into isolated gaseous atoms. For transition metals, this energy is directly related to the strength of metallic bonding in the solid. The key idea is:
More unpaired d‑electrons → stronger metallic bonding → higher enthalpy of atomisation.
In the middle of each series (e.g., Cr, Mo, W), the number of unpaired d‑electrons is largest, so the metallic bond is strongest and peaks. At the ends (e.g., Zn, Cd, Hg), the d‑subshell is fully filled (no unpaired electrons), metallic bonding is weak, and is low.
The higher values for 4d and 5d series compared to 3d arise because the 4d and 5d orbitals are more diffuse and extend further from the nucleus, allowing greater overlap between neighbouring atoms and thus stronger bonding.
Key formula developed from this figure
The textbook uses the figure to illustrate the relationship between enthalpy of atomisation and metallic bond strength, but no single formula is derived from the graph itself. Instead, the figure supports the general expression for the enthalpy change of atomisation:
…
…