Economics · Ch 2 — Collection of Data
Random Sampling
Random Sampling
Random sampling selects the individual units from the population at random, so that every unit has an equal chance of being included.
Consider a government study of how a petrol-price rise affects household budgets in a locality of 300 households, for which a representative sample of 30 households is needed. The names of all 300 households are written on slips, mixed together, and 30 are drawn out one by one.
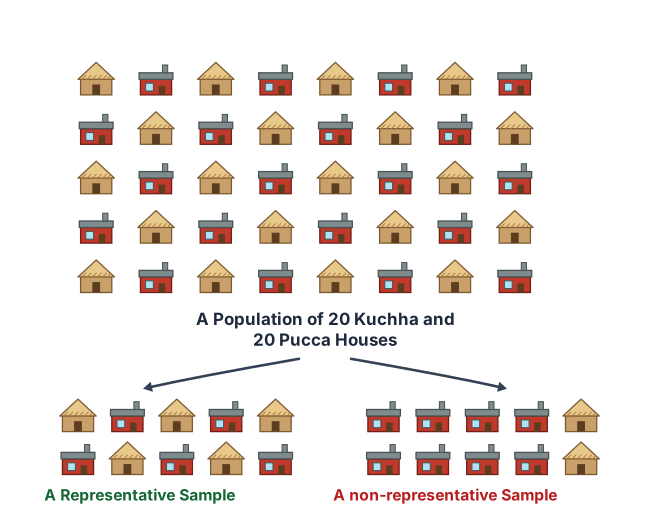
Drawn by us to help you understand the concept clearly, and verified to make sure it's accurate. For exams, practice from your textbook's own diagram.
Our own data-recreation of the NCERT pictogram: 40 house icons (20 kuchha-style, 20 pucca-style) standing for the population, with two arrows fanning down to a 5-kuchha/5-pucca ‘Representative Sample’ group that keeps the population's 1:1 mix, and a skewed ‘8-pucca/2-kuchha’ ‘non-representative Sample’ group that does not — exactly the point the lottery-method example above makes about every unit needing an equal chance of selection. The house counts and grouping are facts taken from t …
Because all 300 units of the sampling frame had an equal chance of being chosen, the 30 drawn form a random sample. This is the lottery method; nowadays computer programmes (and random-number tables) are used to pick random samples.
Exit Polls
You must have seen that when an election takes place, the television networks provide election coverage and also try to predict the results. This is done through exit polls, wherein a random sample of voters who exit the polling booths are asked whom they voted for. From the data of this sample of voters, the prediction is made. You might have noticed that exit polls do not always predict correctly — why?
Activity
…