Economics · Ch 5 — Measures of Central Tendency
Arithmetic Mean for Series of Ungrouped Data
Arithmetic Mean for Series of Ungrouped Data
For an ungrouped series (a plain list of individual values) the mean can be found by three equivalent methods.
Direct method
Add every observation and divide by their number:
Example. Marks of five students: 40, 50, 55, 78, 58.
The average mark is 56.2.
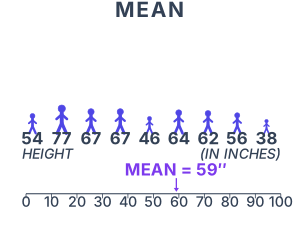
Drawn by us to help you understand the concept clearly, and verified to make sure it's accurate. For exams, practice from your textbook's own diagram.
The figure shows nine simple human silhouettes of differing height, each labelled with its height in inches (54, 77, 67, 67, 46, 64, 62, 56, 38), in the same order the book prints them -- not sorted. Beneath the scene, the worked calculation is shown directly:
The number line under the figure runs from 0 to 100 inches, with an arrow marking where the computed mean (59") falls. Unlike the median or the mode, the mean is not any one of the nine actual heights -- it is a computed value that can fall between two data points, which is exactly what the arrow on the number line is showing: 59" sits between the 56" and 62" figures, not on top of either one. This is the figure's core teaching point: the arithmetic mean is pulled by every sing …
Assumed mean method
When the observations are many or the figures are large, direct addition is tedious. Instead pick any convenient value (existing in the data or not; a centrally located value keeps the arithmetic small) as an assumed mean. For each observation find the deviation , total them as , and correct the assumed mean:
Example. Weekly incomes (Rs) of 10 families: 850, 700, 100, 750, 5000, 80, 420, 2500, 400, 360. Taking :
| Family | Income (X) | d = X − 850 |
|---|---|---|
| A | 850 | 0 |
| B | 700 | −150 |
| C | 100 | −750 |
| D | 750 | −100 |
| E | 5000 | +4150 |
| F | 80 | −770 |
| G | 420 | −430 |
| H | 2500 | +1650 |
| I | 400 | −450 |
| J | 360 | −490 |
| Total | +2660 |