Economics · Ch 4 — Presentation of Data
Textual Presentation of Data
Textual Presentation of Data
In textual presentation the data are described inside the running text itself, as part of the paragraph. It works best when the quantity of data is small, because then a sentence or two can carry all the figures without becoming clumsy.
Two illustrations show the style:
- During a bandh protesting a fuel-price hike (8 September 2005) in a town of Bihar, of the petrol pumps 5 were open and 17 closed, while of the schools 9 were open and 2 closed.
- The Census of India 2001 reported the population had risen to 102 crore — 49 crore females against 53 crore males; 74 crore lived in rural areas and 28 crore in towns; and there were 62 crore non-workers against 40 crore workers. …
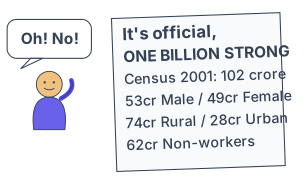
Drawn by us to help you understand the concept clearly, and verified to make sure it's accurate. For exams, practice from your textbook's own diagram.
Our own line-art cartoon (not traced from NCERT). The figures scattered through the clipping are the very numbers Case 2 above just described in prose — this is exactly the drawback textual presentation has: a reader has to hunt through the whole passage to pull out any one figure, which is why the chapter …