Physics · Ch 12 — Atoms
Atomic Spectra
Atomic Spectra
The Hydrogen Atom Spectrum: From Discrete Lines to Energy Levels
The story of atomic spectra begins with a simple observation that shattered classical physics. When hydrogen gas is heated or electrically excited, it does not emit a continuous rainbow of colours. Instead, it glows with a few distinct, sharp colours — a line spectrum. This is not what classical electromagnetism predicts. According to Maxwell's theory, an accelerating electron should radiate energy continuously, spiralling into the nucleus and producing a continuous spectrum. Nature disagrees. The hydrogen spectrum is the fingerprint of quantum behaviour, and it was the key that unlocked the structure of the atom.
The experimental setup is straightforward. A discharge tube containing hydrogen gas at low pressure is connected to a high voltage. The gas glows, and the light passes through a narrow slit, then through a prism or diffraction grating. What appears on the screen is not a band of colours but a series of sharp, isolated lines at specific wavelengths. These lines are not random — they fall into distinct families called spectral series.
The fact that atoms emit only certain wavelengths means that electrons can only exist in certain energy states. This is the single most important experimental fact that led to the Bohr model.
The Balmer Series: A Pattern in the Visible
The most famous series lies partly in the visible region. In 1885, Johann Balmer, a Swiss schoolteacher, found a simple formula that reproduced the wavelengths of the four visible hydrogen lines (Hα, Hβ, Hγ, Hδ) with astonishing accuracy. He expressed it as:
where for the four visible lines, and is a constant now called the Rydberg constant for hydrogen. The modern value is .
The four lines correspond to:
- : Hα (red, 656.3 nm)
- : Hβ (blue-green, 486.1 nm)
- : Hγ (violet, 434.1 nm)
- : Hδ (violet, 410.2 nm)
Do not confuse the Rydberg constant with the Rydberg energy . They are related but different — has units of inverse length, while is an energy.
The Generalised Rydberg Formula: All Series
Balmer's success prompted a search for other series. They were found — in the ultraviolet and infrared — and all fit a generalised form. The Swedish spectroscopist Johannes Rydberg wrote the universal formula:
where is the final principal quantum number (the lower energy level) and is the initial principal quantum number (the higher energy level), with . Each choice of defines a spectral series:
| Series name | Spectral region | ||
|---|---|---|---|
| Lyman | 1 | 2, 3, 4, … | Ultraviolet |
| Balmer | 2 | 3, 4, 5, … | Visible and near-ultraviolet |
| Paschen | 3 | 4, 5, 6, … | Infrared |
| Brackett | 4 | 5, 6, 7, … | Infrared |
| Pfund | 5 | 6, 7, 8, … | Far infrared |
The Lyman series lies entirely in the ultraviolet — you cannot see it with your eyes. The Balmer series is the only one with lines in the visible region. This is why Balmer found it first — it was the only one detectable with simple optical instruments.
The Physical Meaning: Energy Level Transitions
The Rydberg formula is not just a numerical curiosity. It tells us something profound about the atom. Rewrite it in terms of the wavenumber (the number of waves per unit length):
Now multiply both sides by (Planck's constant times the speed of light). Since , we get:
This is the energy of the emitted photon. It equals the difference between two atomic energy levels:
where is the energy of the initial state (higher energy) and is the energy of the final state (lower energy). Comparing the two expressions, we see that the energy of a state with principal quantum number must be:
The negative sign means the electron is bound to the nucleus — you must add energy to remove it. The ground state () has the most negative energy, and as increases, the energy approaches zero (the ionisation limit).
This is the famous hydrogen energy level formula. The constant is the ionisation energy of hydrogen — the minimum energy needed to remove the electron from the ground state.
The Rydberg Constant in Terms of Fundamental Constants
Bohr's model derived the Rydberg constant from first principles:
where is the electron mass, is the elementary charge, is the permittivity of free space, is Planck's constant, and is the speed of light. Plugging in the numbers gives , in excellent agreement with experiment. …
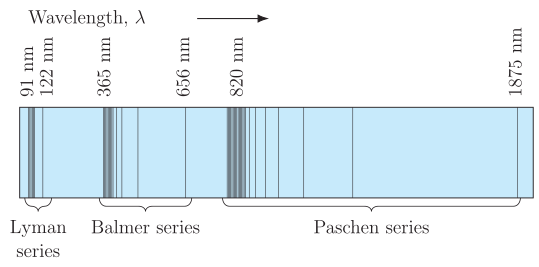
Drawn by us to help you understand the concept clearly, and verified to make sure it's accurate. For exams, practice from your textbook's own diagram.
Fig. 12.5 is a schematic of the emission line spectrum of atomic hydrogen. It is not a graph with axes in the usual sense; instead, it is a horizontal strip showing a continuous band of colours (or, in a textbook, a shaded band) with a set of bright, sharp vertical lines at specific positions. The horizontal direction represents increasing wavelength , so the left side corresponds to shorter wavelengths (ultraviolet) and the right side to longer wavelengths (infrared).
The bright lines are grouped into three distinct series. The Lyman series lies at the far left, in the ultraviolet region, with the shortest wavelength line at about 122 nm and a series limit (where lines crowd together) near 91 nm. The Balmer series occupies the visible part of the spectrum, with its first line at 656 nm (red) and the series limit near 365 nm (violet). The Paschen series is in the infrared, starting at 820 nm and converging toward 1875 nm. Within each series, the lines become more closely spaced as they approach the short-wavelength limit — a clear visual clue that the energy levels of the hydrogen atom are not equally spaced.
The figure shows emission lines, not absorption lines. Each bright line corresponds to a specific wavelength of light emitted when an electron in an excited hydrogen atom drops from a higher energy level to a lower one.
The physical idea this figure teaches is that the hydrogen atom emits light only at certain discrete wavelengths, not a continuous rainbow. This discreteness was the key clue that led to the Bohr model of the atom. The pattern of lines is summarised by the Rydberg formula:
Here is the wavelength of the emitted light (in vacuum), is the Rydberg constant for hydrogen (approximately ), is the principal quantum number of the lower (final) energy level, and is the principal quantum number of the higher (initial) energy level, with .
Each series corresponds to a fixed :
- Lyman series: (ultraviolet)
- Balmer series: (visible)
- Paschen series: (infrared)
The series limit for a given occurs when , giving the shortest possible wavelength in that series: . For the Balmer series, this limit is nm, matching the marker in the figure. …