Q.Using Einstein's photoelectric equation, draw a graph of the maximum kinetic energy of the photoelectrons emitted from a photosensitive metal surface against the frequency of the incident light, and describe how the work function of the metal can be determined from this graph. (1+1) OR What is the significance of the total negative energy of an electron revolving in a stationary orbit of an atom?
🔒You're viewing a preview — the full solution, concept, methods & PYQ mapping are locked.
🔒 Start your 14-day free trial to unlock the full solution →Concept understanding — Photoelectric Effect
The Photoelectric Effect: When Light Knocks Electrons Loose
Imagine you're throwing tennis balls at a wall covered in loose pebbles. If you throw hard enough, a pebble might get knocked off. That's the basic picture — but the photoelectric effect is the quantum version of this, and it completely shattered classical physics.
The Intuition
Light is made of tiny packets of energy called photons. Each photon carries a specific amount of energy, determined by its colour (frequency). When a photon hits a metal surface, it can transfer its energy to an electron inside the metal. If that energy is enough, the electron breaks free and flies out.
Think of electrons in a metal like people in a room with a high window. To escape, they need enough energy to reach the window sill. A photon is like a boost — but only if it gives enough energy in one shot. No amount of weak boosts (dim light) will work if each individual boost is too small.
The Precise Statement
Ephoton=hf=ϕ+Kmax
Where:
- Ephoton=hf is the energy of a photon (Planck's constant h=6.63×10⁻³⁴ J⋅s, f is frequency)
- ϕ is the work function — the minimum energy needed to remove an electron from that metal
- Kmax is the maximum kinetic energy of the ejected electron
What Classical Physics Got Wrong
Before Einstein (1905), physicists thought light was a continuous wave. They expected:
- Brighter light → more energy per electron → faster electrons
- Any colour would eventually eject electrons if you waited long enough
But experiments showed the opposite:
| Observation | Classical Prediction | Actual Result |
|---|---|---|
| Effect of intensity | Brighter light → faster electrons | Brighter light → more electrons, same speed |
| Threshold frequency | None — any light works eventually | Below a certain frequency, no electrons no matter how bright |
| Time delay | Electrons need time to absorb energy | Electrons appear instantly (within 10−9 s) |
The Key Insight
Einstein said: light behaves like a stream of particles (photons), each with energy hf. One photon interacts with one electron. If hf<ϕ, the electron cannot escape — period. If hf>ϕ, the excess energy becomes kinetic energy:
Kmax=hf−ϕ
This is why:
- Increasing intensity (more photons) ejects more electrons, but each electron still gets the same energy per photon — so their speed doesn't change.
- Below threshold frequency, even a trillion photons per second can't help — each one is too weak individually.
The photoelectric effect proved that light is quantized — it comes in discrete packets. This was the birth of quantum mechanics. Einstein won the 1921 Nobel Prize for this, not for relativity.
A Worked Example
Problem: A metal has work function ϕ=2.0 eV. Light of frequency f=6.0×10¹⁴ Hz shines on it. Find the maximum kinetic energy of ejected electrons. (h=4.14×10⁻¹⁵ eV⋅s)
Step 1: Photon energy
E=hf=(4.14×10⁻¹⁵)(6.0×10¹⁴)=2.48 eV …
Why this formula?
Photoelectric Effect: Why the Key Formulas Hold
The photoelectric effect is a cornerstone of quantum physics. It showed that light behaves as particles (photons) , not just waves. Let's build the reasoning step-by-step.
1. The Core Idea: Energy Conservation
When a photon hits a metal surface, it transfers all its energy to a single electron inside the metal.
- The photon's energy is E=hf, where h is Planck's constant and f is the frequency of light.
- The electron needs a minimum energy to escape the metal — this is called the work function, ϕ.
Why only one electron?
Einstein proposed that light is quantized into discrete packets (photons). A single photon cannot split its energy among multiple electrons — it interacts with one electron at a time.
2. The Photoelectric Equation
If the photon's energy is greater than the work function, the excess energy becomes the electron's kinetic energy after escape:
hf=ϕ+Kmax
Where:
- hf = energy of incident photon
- ϕ = work function (minimum energy to remove electron)
- Kmax = maximum kinetic energy of ejected electron
Why "maximum" kinetic energy?
- Electrons inside the metal have different binding energies.
- Some electrons are near the surface (loosely bound) → get maximum K.
- Others are deeper → lose energy in collisions before escaping → lower K.
3. The Stopping Potential Connection
We measure Kmax using a stopping potential Vs:
Kmax=eVs
Where e is the electron charge. This is because:
- An electric field opposing the electron's motion does work eVs to stop it.
- At the stopping potential, the electron's kinetic energy is exactly balanced by the electric potential energy.
Combining:
hf=ϕ+eVs
This is the Einstein photoelectric equation in its most testable form.
4. Why the Threshold Frequency Exists
From the equation:
hf=ϕ+eVs
If f is too low, hf<ϕ. Then:
- The photon cannot supply enough energy to overcome the work function.
- No electron is ejected, regardless of light intensity.
The threshold frequency f0 is when Kmax=0:
hf0=ϕ⇒f0=hϕ
Why intensity doesn't matter for ejection?
- Intensity = number of photons per second.
- Each photon still has energy hf. If hf<ϕ, even a billion photons won't eject an electron — each photon is individually too weak.
5. Why Kinetic Energy Depends on Frequency, Not Intensity
From Kmax=hf−ϕ:
- Frequency f directly determines Kmax.
- Intensity only affects the number of electrons ejected (more photons → more electrons), not their individual energy.
This was the key experimental contradiction with classical wave theory:
- Classical: Higher intensity = bigger wave amplitude = more energy to electrons.
- Reality: Higher frequency = more energy per electron; intensity only changes current.
6. Summary of Key Relationships …
Einstein's photoelectric equation makes the maximum kinetic energy a straight-line function of the incident frequency, so a plot of the two is a straight line whose slope is Planck's constant. The point where this line meets the frequency axis marks where emission just begins, which is what fixes the work function. …
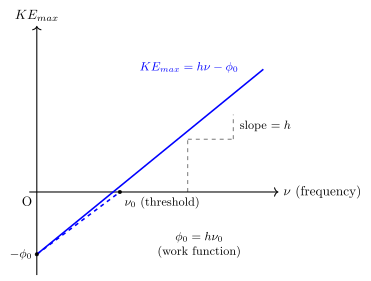
Einstein's equation KEmax = hν − φ0 is linear in ν, so plotting KEmax vs ν gives a straight line of slope h; its ν-intercept is the threshold frequency ν0, from which φ0 = hν0.
Einstein's photoelectric equation is
Kmax=hν−ϕ0
Plotting Kmax (y-axis) against ν (x-axis) gives a straight line with:
- slope = h (Planck's constant), the same for every metal;
- x-intercept at ν = ν0 (the threshold frequency), where Kmax = 0;
- y-intercept (extended back to ν = 0) at −φ0. …
Showing the 12 most recent of 113 on this concept.
- CBSE 2026Set 55/2/11 markMCQQ.The maximum kinetic energy of the electrons emitted from a photosensitive surface depends on (A) work function of the surface ϕ0 only. (B) frequency of the incident radiation ν only. (C) intensity of the incident radiation I only. (D) Both ϕ0 and ν.
›Reveal solutionSolution
The maximum kinetic energy of photoelectrons is determined by Einstein's photoelectric equation: it depends on both the photon energy (set by frequency ν) and the work function ϕ0 of the material. The answer is (D).
Why the photoelectric effect reveals energy quantization
When light strikes a metal surface, electrons can be ejected—but not in the way classical wave theory predicted. Einstein's revolutionary insight was that light arrives in discrete packets (photons), each carrying energy E=hν. An electron absorbs one photon entirely; if that energy exceeds the minimum needed to escape the metal (the work function ϕ0), the electron breaks free, and any leftover energy becomes kinetic energy.
This is fundamentally an energy-balance problem. The photon delivers a fixed amount of energy hν. The electron must "pay" ϕ0 to escape. What remains is the maximum kinetic energy:
Kmax=hν−ϕ0
Notice what this equation tells us: Kmax increases linearly with frequency ν and decreases with larger work function ϕ0. Both parameters matter.
Step-by-step reasoning
-
The photon energy is hν.
A single photon of frequency ν carries energy proportional to that frequency. Higher frequency means more energetic photons (ultraviolet photons pack more punch than red photons).
-
The work function ϕ0 is the escape barrier.
Different materials bind their electrons with different strengths. Cesium has a low work function (~2 eV), so even visible light can eject electrons. Platinum has a high work function (~6 eV), requiring ultraviolet light. This material property directly subtracts from the available kinetic energy.
-
Energy conservation gives Kmax=hν−ϕ0.
The electron that escapes with maximum kinetic energy is one that was initially at the Fermi level (loosest bound) and lost no energy to collisions on the way out. All the "profit" after paying ϕ0 goes into kinetic energy.
-
Intensity does not affect Kmax.
Intensity measures the number of photons arriving per unit time, not the energy of each photon. Brighter light ejects more electrons (higher photocurrent), but each electron still gets energy from just one photon. Doubling intensity doubles the electron count, not their individual speeds. …
-
- CBSE 2026Set 55/2/11 markMCQQ.Two statements are given – one labelled Assertion (A) and the other Reason (R). Select the correct answer from the codes below: (A) Both (A) and (R) are true and (R) is the correct explanation of (A). (B) Both (A) and (R) are true, but (R) is not the correct explanation of (A). (C) (A) is true, but (R) is false. (D) (A) is false and (R) is also false. Assertion (A) : On increasing the intensity of incident light of frequency ν(>ν0) on a photosensitive surface, the photocurrent increases. Reason (R) : The stopping potential for a photosensitive surface increases with increase of frequency ν(>ν0) of incident light.
›Reveal solutionSolution
The Assertion is true because photocurrent depends on the number of photoelectrons, which increases with light intensity. The Reason is also true — stopping potential depends on frequency, not intensity. But the Reason does not explain the Assertion, since they involve different physical mechanisms. So the correct choice is (B).
The core physics: photoelectric effect and the two separate ideas
The photoelectric effect has a clean conceptual split that many students miss. There are two independent things happening when light hits a metal surface:
- How many electrons come out — this is governed by the intensity of light (number of photons per second). More photons → more electrons ejected → larger photocurrent.
- How much kinetic energy each electron has — this is governed by the frequency of light (energy per photon). Higher frequency → more energy per electron → you need a larger stopping potential to bring them to rest.
These two are completely separate. Intensity does not affect the energy of individual electrons; frequency does not affect how many electrons are ejected (above threshold). This is the key insight that makes the question straightforward.
Step-by-step reasoning
1. Understanding the Assertion (A)
On increasing the intensity of incident light of frequency ν>ν0 on a photosensitive surface, the photocurrent increases.
When frequency is above the threshold ν0, every photon that hits the surface can eject a photoelectron (assuming it's absorbed). Intensity means the number of photons per second per unit area. If you increase intensity, more photons arrive each second, so more electrons are knocked out. The photocurrent (rate of flow of charge) is directly proportional to the number of electrons emitted per second.
Photocurrent ∝ Intensity (for ν>ν0)
So the Assertion is true.
2. Understanding the Reason (R)
The stopping potential for a photosensitive surface increases with increase of frequency ν>ν0 of incident light.
Stopping potential Vs is the voltage needed to stop the most energetic photoelectrons. Einstein's photoelectric equation gives:
Kmax=hν−ϕ0
where ϕ0 is the work function. Since Kmax=eVs, we have:
eVs=hν−ϕ0⇒Vs=ehν−eϕ0
This is a straight line with slope h/e. As ν increases, Vs increases linearly. So the Reason is also true. …
- CBSE 2026Set 55/3/11 markMCQQ.Radiation of wavelength 200 nm is incident on a photosensitive surface of work function 4.2 eV. The kinetic energy of the fastest photoelectrons emitted from this surface will be close to : (A) 3.5 eV (B) 3.0 eV (C) 2.5 eV (D) 2.0 eV
›Reveal solutionSolution
The fastest photoelectron’s kinetic energy is found from Einstein’s photoelectric equation: Kmax=hν−ϕ. Converting wavelength to frequency and using the given work function gives Kmax≈2.0 eV, so the correct option is (D).
The photoelectric effect is a clean, direct application of energy conservation: a photon gives all its energy to an electron. The electron uses some of that energy to escape the surface (the work function ϕ), and whatever remains shows up as kinetic energy. The fastest electron is the one that loses the least energy on its way out — so its kinetic energy is simply hν−ϕ.
Let’s walk through it.
- Find the photon energy in eV. Wavelength λ=200 nm =200×10−9 m. Photon energy E=hν=λhc. Use the handy constant hc=1240 eV·nm (this is a standard shortcut for such problems). So
E=200 nm1240 eV⋅nm=6.2 eV.
TipMemorise hc≈1240 eV·nm — it converts wavelength in nm directly to energy in eV without messing with SI units.
- Apply Einstein’s photoelectric equation. The maximum kinetic energy of emitted photoelectrons is
Kmax=hν−ϕ.
Here ϕ=4.2 eV. So
Kmax=6.2 eV−4.2 eV=2.0 eV. …
- CBSE 2026Set 55/3/11 markMCQQ.Assertion (A) : Photoelectric current depends upon the intensity of the incident radiation. Reason (R) : Stopping potential is independent of the intensity of the incident radiation. (A) Both Assertion (A) and Reason (R) are true and Reason (R) is the correct explanation of the Assertion (A). (B) Both Assertion (A) and Reason (R) are true, but Reason (R) is not the correct explanation of the Assertion (A). (C) Assertion (A) is true, but Reason (R) is false. (D) Both Assertion (A) and Reason (R) are false.
›Reveal solutionSolution
The photoelectric current depends on intensity (more photons → more electrons), while stopping potential depends only on frequency (photon energy minus work function). Both statements are true, but the reason does not explain the assertion — they are independent facts about the photoelectric effect. The correct option is (B).
The photoelectric effect is one of those rare topics where a single experiment cleanly separates two ideas that students often mix up: how many electrons get ejected versus how energetic each electron is. The assertion and reason here test exactly that distinction.
The core physics: When light hits a metal surface, each photon can knock out one electron — but only if the photon’s energy (hf) exceeds the metal’s work function (ϕ). The number of electrons ejected (and hence the current) depends on how many photons arrive per second — that’s intensity. But the maximum kinetic energy of each ejected electron depends only on the photon’s frequency, not on how many photons there are.
Let’s walk through each statement carefully.
-
Assertion (A): Photoelectric current depends on the intensity of incident radiation.
Current is charge per second. Each ejected electron carries charge e. So if more electrons leave the metal per second, the current increases. What controls the number of electrons per second? The number of photons striking the metal per second — that is, the intensity (for a fixed frequency).
TipThink of it like rain: intensity is how hard it’s raining (number of raindrops per second). More raindrops → more splashes (electrons). But each splash’s height depends on the size of the raindrop (frequency), not on how many are falling.
So (A) is true.
-
Reason (R): Stopping potential is independent of the intensity of incident radiation.
Stopping potential V0 is the voltage needed to stop the most energetic photoelectrons. Einstein’s photoelectric equation gives:
eV0=hf−ϕ
Here f is the frequency of light, ϕ is the work function. Notice: intensity does not appear anywhere in this equation. Whether you shine a dim light or a bright light of the same colour, the stopping potential stays the same. …
-
- CBSE 2026Set DS1 markQ.The work function of a metal is 3.3 eV. Calculate the minimum frequency of photon that will emit the photoelectron.
›Reveal solutionSolution
The minimum (threshold) frequency is ν0=W/h≈8.0×1014 Hz.
Concept. Photoelectrons are emitted only when the incident photon's energy at least equals the work function W of the metal. The minimum (threshold) frequency corresponds to a photon whose whole energy is used up just to free the electron, with no kinetic energy left:
hu0=W⇒u0=hW.
…
- CBSE 2026Set ANNUAL1 markMCQQ.When light falls on a metal surface, the maximum kinetic energy of the emitted electrons depends upon(a) the time for which light falls on the metal(b) the frequency of the incident light(c) the intensity of the incident light(d) the velocity of the incident light
›Reveal solutionSolution
Maximum kinetic energy of photoelectrons depends only on the frequency of incident light (and the metal's work function), never on intensity or time.
By Einstein's photoelectric equation,
KEmax=hν−ϕ0
where h is Planck's constant, ν is the frequency of the incident light, and ϕ0 is the work function of the metal (a fixed property of the metal surface). Increasing the intensity of light (at fixed frequency) increases the number of photoelectrons emitted per second (photocurre …
- CBSE 2026Set ANNUAL1 markMCQQ.The work function of four metals P, Q, R and S are 2.3 eV, 3.2 eV, 4.25 eV and 5.15 eV respectively. Among these the metal having lowest threshold frequency will be(a) R(b) S(c) Q(d) P
›Reveal solutionSolution
Threshold frequency is directly proportional to work function (nu0 = W/h), so the metal with the smallest work function has the lowest threshold frequency.
Einstein's photoelectric equation gives the threshold frequency as nu0 = W/h, where W is the work function and h is Planck's constant (a fixed constant). Since nu0 scales directly with W, the metal with the smallest work function has the smallest ( …
- CBSE 2026Set ANNUAL1 markQ.If the workfunction of a metal is 4.5 eV and the kinetic energy of the photoelectron emitted from its surface is 1.5 eV, then calculate the energy of a photon of the incident light.
›Reveal solutionSolution
Einstein's photoelectric equation says the photon's energy is used partly to free the electron (work function) and partly becomes its kinetic energy; adding the two gives the photon energy.
…
- CBSE 2026Set ANNUAL1 markMCQQ.Photoelectric effect supports(a) wave nature of light(b) particle nature of light(c) dual nature of light(d) polarization nature of light
›Reveal solutionSolution
Classical wave theory cannot explain the instantaneous emission or the frequency threshold seen in the photoelectric effect; only Einstein's photon (particle) picture of light does.
In the photoelectric effect, light falling on a metal surface ejects electrons. Key observations - that emission starts INSTANTLY (no time lag) even at very low intensity, that there is a definite THRESHOLD FREQUENCY below which no electrons are emitted no matter how intense the light, and that the maximum kinetic energy of emitted electrons depends on FREQUENCY (not intensity) - cannot be explained by the classical wave theory of light. Einstein explained these features by treating light as made of discrete quanta (photons) of …
- CBSE 2026Set ANNUAL1 markQ.Define work function of metal.
›Reveal solutionSolution
Work function is the minimum energy needed to pull the least tightly bound electron out of a metal surface.
Electrons inside a metal are held back from escaping by attractive forces from the positive ions in the lattice. The work function phi_0 is defined as the minimum energy that must be supplied to an electron (typically the most energetic, least tightly bound one, at the Fermi level) so that it can just escape from the metal surface, with no kinetic energy left over. It is usually expressed in electron-volts (eV) and is related to the thre …
- CBSE 2026Set ANNUAL1 markMCQQ.Stopping potential is minimum for:(a) Yellow(b) Blue(c) Violet(d) Red
›Reveal solutionSolution
Stopping potential increases with the frequency of incident light; red light has the lowest frequency among the options, so it gives the minimum stopping potential.
By Einstein's photoelectric equation, eV0=hν−ϕ0, so stopping potential V0 increases linearly with frequency ν. Among yellow, blue, violet and red light, red has the longest wavel …
- CBSE 2026Set ANNUAL1 markMCQQ.The work function of caesium metal is 2.14 eV. When light of frequency 6 × 10^14 Hz is incident on the metal surface, photoemission of electrons occurs. What is the Stopping potential?(a) 34 V(b) 3.4 V(c) 340 V(d) 0.34 V
›Reveal solutionSolution
Using Einstein's photoelectric equation, the stopping potential comes out to about 0.34 V.
Step 1 — photon energy:
E=hν=(6.626×10⁻³⁴)(6×10¹⁴)=3.976×10⁻¹⁹ J
Converting to eV: 1.602×10−193.976×10⁻¹⁹≈2.48 eV
Step 2 — Einstein's photoelectric equation:
Kmax=hν−ϕ0=2.48−2.14=0.34 eV
…
🎓Unlock everything free for 14 days
- ✓Full step-by-step solutions
- ✓Concept-first explanations
- ✓Methods, shortcuts & mistakes
- ✓PYQ mapping + timed mock tests
Full access for 14 days. No credit card required.