Physics · Ch 10 — Wave Optics
Coherent and Incoherent Addition of Waves
Coherent and Incoherent Addition of Waves
Core Idea: Superposition and Interference
When two or more waves overlap in space, the principle of superposition applies: the resultant displacement at any point is the vector sum of the displacements due to each individual wave. This leads to the phenomenon of interference — the redistribution of energy in space, forming a pattern of alternating maxima (bright) and minima (dark) regions.
Coherent vs. Incoherent Sources
-
Coherent sources: Two sources are coherent if the phase difference between the waves they produce at any point does not change with time.
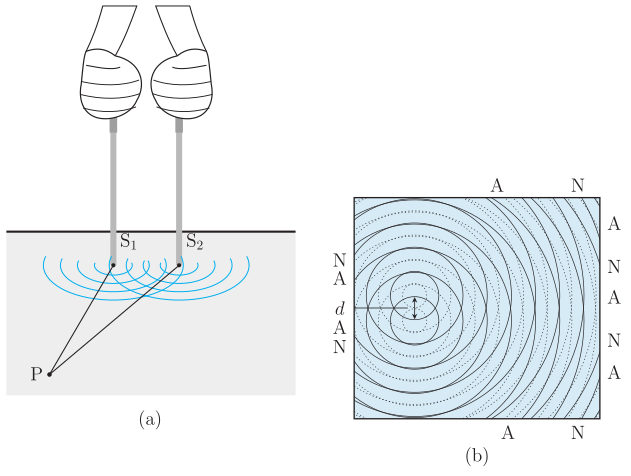
- Example: Two identical needles oscillating in phase in a water trough (Fig. 10.8a).
- For coherent sources, a stable interference pattern (fixed positions of maxima and minima) is observed.
-
Incoherent sources: If the phase difference between the two sources changes rapidly with time, the sources are incoherent.
- In this case, the interference pattern fluctuates so fast that the eye (or detector) sees only a time-averaged intensity.
- The result: intensities simply add up — no stable pattern.
Constructive and Destructive Interference
Consider two coherent sources and vibrating in phase. Let the displacement at a point due to be:
Case 1: Path difference = integer multiple of
If the path difference (where ), the waves arrive in phase.
The displacement due to is:
Resultant displacement:
Since intensity , the resultant intensity is:
where is the intensity from each source alone (). This is constructive interference.
Case 2: Path difference = half-integer multiple of
If (where ), the waves arrive exactly out of phase (phase difference ).
The displacement due to is:
Resultant displacement:
Resultant intensity is zero. This is destructive interference.
General Expression for Intensity
For an arbitrary point , let the phase difference between the two waves be . Then:
Using the trigonometric identity , the resultant displacement is:
…
Drawn by us to help you understand the concept clearly, and verified to make sure it's accurate. For exams, practice from your textbook's own diagram.
What the Figure Shows
Figure 10.8 has two panels from a water trough experiment.
Panel (a) shows two needles, labelled S₁ and S₂, dipping into water and oscillating up and down in phase — meaning they reach their highest and lowest points together. Each needle acts as a coherent source, sending out circular ripples (crests and troughs) that spread outward.
Panel (b) shows the overlapping ripple pattern at a single instant. Solid circles represent crests (maximum upward displacement) and dashed circles represent troughs (maximum downward displacement) from each source. Where crests from S₁ and S₂ cross, the water displacement is maximum — these are antinodal lines (A). Where a crest from one source meets a trough from the other, the displacement cancels — these are nodal lines (N). The lines fan out radially from the region between S₁ and S₂.
The key physical idea is that two coherent sources produce a stable interference pattern of alternating constructive and destructive interference, because the phase difference at any point does not change with time.
The Key Formulas Developed from This Figure
The textbook uses this figure to derive the conditions for interference:
- Constructive interference (maximum intensity, antinodal lines):
where and are distances from the two sources to point , is the wavelength, and means the absolute difference. The resultant intensity is , where is the intensity from one source alone.
- Destructive interference (zero intensity, nodal lines):
The resultant intensity is zero.
- General intensity formula for any point with phase difference :
Here is the phase difference between the two waves at that point. The phase difference is related to the path difference by:
Physical Meaning …
Drawn by us to help you understand the concept clearly, and verified to make sure it's accurate. For exams, practice from your textbook's own diagram.
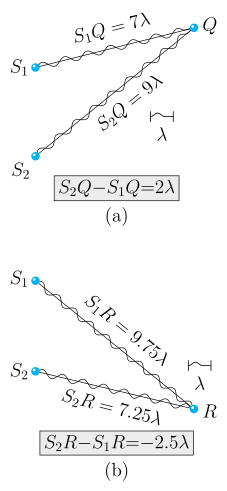
Figure 10.9 is a schematic diagram with two separate panels, (a) and (b), each showing two coherent point sources and separated by a distance on the left, and a single field point on the right. Straight line segments are drawn from each source to the field point, representing the path lengths , in panel (a) and , in panel (b). The labels and mark the field points, and the path differences are explicitly written as and respectively.
Physical idea: The figure illustrates how the path difference between two coherent waves determines whether they interfere constructively or destructively. When the path difference is an integer multiple of the wavelength , the waves arrive in phase and produce a bright fringe (constructive interference). When the path difference is a half-integer multiple of , the waves arrive exactly out of phase and cancel completely (destructive interference).
Panel (a) — Constructive interference at Q:
Here . Since corresponds to a phase difference of (because ), the two waves are in phase. The resultant displacement is , so the amplitude doubles. The intensity, proportional to the square of the amplitude, becomes , where is the intensity from a single source.
Panel (b) — Destructive interference at R:
Here . This path difference corresponds to a phase difference of . The waves are exactly out of phase: if , then . The resultant displacement is , giving zero intensity.
Key formula developed from this figure:
For two coherent sources vibrating in phase, the condition for constructive interference at a point is
and for destructive interference …
Drawn by us to help you understand the concept clearly, and verified to make sure it's accurate. For exams, practice from your textbook's own diagram.
What the Figure Shows
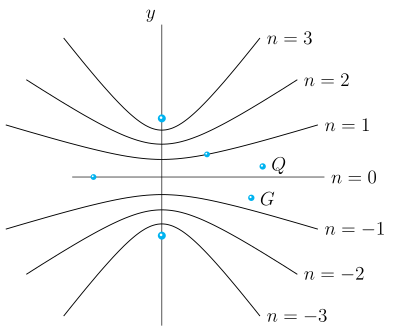
The figure is a schematic diagram of the interference pattern produced by two coherent point sources, S₁ and S₂. The sources are placed close together on the vertical axis, with S₁ above S₂. The diagram does not show wavefronts or intensity directly; instead, it shows the loci of points where the path difference is constant.
- The horizontal axis (left–right) represents the direction perpendicular to the line joining the sources.
- The vertical axis (up–down) is the line containing S₁ and S₂.
- The curves are a family of confocal hyperbolas, all sharing S₁ and S₂ as foci.
- The central curve () is the straight horizontal line that is the perpendicular bisector of S₁S₂. Here .
- Above and below this line are hyperbolas labelled , corresponding to .
- Two specific points are marked: Q (upper region) and G (lower region), representing arbitrary points on the pattern.
Physical Idea Taught
The figure visualises the condition for constructive and destructive interference from two coherent sources. The key idea is that the path difference determines the phase difference between the waves arriving at a point P:
- Constructive interference (maximum intensity ) occurs when (). These are the hyperbolas labelled in the figure.
- Destructive interference (zero intensity) occurs when (). These hyperbolas lie between the labelled ones (not explicitly labelled in the figure).
The figure thus maps out the stable interference pattern in space: bright fringes (maxima) lie on the labelled hyperbolas, and dark fringes (minima) lie halfway between them.
Key Formulas Developed with This Figure
The textbook uses the geometry of the figure to derive the general intensity formula. For two coherent sources vibrating in phase, the resultant intensity at any point P is:
where:
- = intensity from each source alone (proportional to , with the amplitude)
- = phase difference between the two waves at P, given by
- = path difference
The conditions for maxima and minima follow directly: …