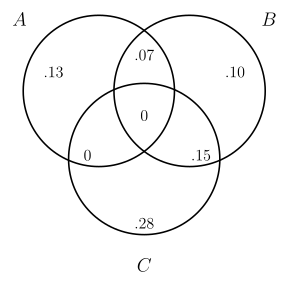
Q.The accompanying Venn diagram shows three events, A, B, and C, and also the probabilities of the various intersections (for instance, ). From the diagram, the region in A only , , the region in B only , , and the region in C only . Determine
You're viewing a preview — the full solution, concept, methods & PYQ mapping are locked.
Start your 14-day free trial to unlock the full solution →Use the addition rule for probabilities by summing the disjoint regions shown in the Venn diagram. The answers are: (a) 0.20,
(b) 0.17,
(c) 0.30,
(d) 0.13, (e) 0.15, (f) 0.51.
The key idea is that a Venn diagram breaks the sample space into disjoint (non-overlapping) regions. Each region’s probability is given directly. To find the probability of any event, you simply add the probabilities of the regions that lie inside that event’s boundary. No formulas beyond addition are needed — just careful reading of the diagram.
Let’s label the regions clearly. The diagram gives:
- Region only in A:
- (the overlap of A and B, but not including C):
- Region only in B:
- (the overlap of B and C, but not including A):
- Region only in C:
What’s missing? The triple intersection and the region (excluding B) are not given explicitly. But from the diagram, the total probability of all regions must sum to 1. Let’s denote:
- (the part of A and C that does not include B)
We also have the region outside all three events. Let’s call it .
The sum of all disjoint regions is:
That gives , so .
Without further information, we cannot determine , , and individually. But for most parts of the question, we don’t need them — we only need the regions that are directly given or can be combined from given data.
Let’s go part by part.
- A consists of: only A (), (), and the triple intersection , plus (which is ). So
But we don’t know yet. However, note that the problem likely expects us to use only the given numbers — the diagram probably shows all intersections. A common exam trick: the region is not listed, so it might be zero. Let’s check: if had any probability, it would be shown. Since it’s not, we assume . Similarly, the triple intersection is not shown, so . Then .
This is the standard interpretation: the Venn diagram shows all non-zero intersections. So:
- This means “B and not C”. From the diagram, B has two parts: the part with C () and the part without C. The part without C is: only B () plus (). So
- …
Unlock everything free for 14 days
- Full step-by-step solutions
- Concept-first explanations
- Methods, shortcuts & mistakes
- PYQ mapping + timed mock tests
Full access for 14 days. No credit card required.