Economics · Ch 2 — National Income Accounting
Circular Flow of Income and Methods
Circular Flow of Income and Methods
The Circular Flow of Income
The simplest way to understand how an entire economy functions is to imagine it as a circular flow between two groups: households and firms. In this basic model, we deliberately strip away complications — no government, no foreign trade, and no savings. Households own all the factors of production and supply them to firms. Firms use these factors to produce goods and services, which they sell back to households.
What do households receive in return for their contributions? There are four fundamental types of factor payments, each corresponding to a different contribution to production:
- Wages — the remuneration for human labour
- Interest — the remuneration for capital
- Profit — the remuneration for entrepreneurship
- Rent — the remuneration for land (fixed natural resources)
In this simplified economy, households have only one way to use their income: they spend every rupee they earn on the goods and services produced by domestic firms. There are no taxes (no government), no imports (no external trade), and no savings. So the entire income that households receive flows back to firms as sales revenue. The aggregate consumption expenditure of households equals the aggregate expenditure on goods and services produced by firms. There is no leakage from the system — the amount firms distribute as factor payments is exactly equal to the consumption expenditure they receive back.
This circular movement continues period after period. Firms produce, pay incomes, households spend, firms receive revenue, and produce again. The income of the economy circulates endlessly between the two sectors.
The Circular Flow Diagram
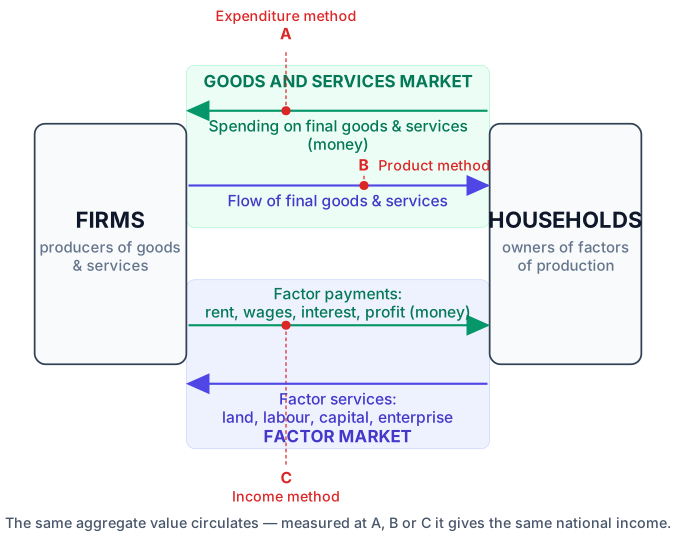
The textbook describes Figure 2.1, which represents this circular flow. The diagram has two sets of arrows, one at the top and one at the bottom.
At the top of the diagram, we see the goods and services market. The uppermost arrow runs from households to firms — this represents the spending that households undertake to buy goods and services. The arrow directly below it runs from firms to households — this represents the actual goods and services flowing from firms to households. So the top pair of arrows shows: households pay money to firms (upper arrow), and firms send goods and services to households (lower arrow).
At the bottom of the diagram, we see the factors of production market. The lowermost arrow runs from households to firms — this represents the factor services (labour, capital, land, entrepreneurship) that households provide to firms. The arrow above it runs from firms to households — this represents the payments (wages, interest, rent, profit) that firms make to households for those services.
The same money — representing the aggregate value of goods and services — moves in a circle. This gives us a powerful insight: we can measure the aggregate value of goods and services produced during a year by measuring the flow at any of three points in the circle.
Drawn by us to help you understand the concept clearly, and verified to make sure it's accurate. For exams, practice from your textbook's own diagram.
The figure shows a simple two-sector economy — no government, no savings, no foreign trade. On the left is a box labelled FIRMS; on the right, a box labelled HOUSEHOLDS. Four horizontal arrows connect them, forming a closed loop.
The top two arrows represent the goods and services market. The upper arrow runs from households to firms and is labelled as the flow of payments (spending) that households make to buy final goods and services. This flow is measured at point A. The arrow just below it runs from firms to households and represents the flow of goods and services that households receive in exchange.
The bottom two arrows represent the factor market. The lowermost arrow runs from households to firms and shows the factor services (land, labour, capital, enterprise) that households supply to firms. The arrow just above it runs from firms to households and shows the factor payments (rent, wages, interest, profit) that firms make for those services.
Three dotted measuring lines cross the flows at key points:
- Point A (on the uppermost arrow) — aggregate spending, used in the expenditure method.
- Point B (on the goods-flow arrow) — aggregate value of final goods produced, used in the product method.
- Point C (on the factor-payments arrow) — aggregate factor incomes, used in the income method. …
The Three Methods of Measuring National Income
Because the same value circulates, we have three equivalent ways to estimate national income. The textbook marks three measurement points on the circular flow diagram:
Point A — measuring the uppermost flow (households' spending on final goods and services). This is the expenditure method.
Point B — measuring the aggregate value of final goods and services produced by all firms. This is the product method (also called the value-added method).
Point C — measuring the sum total of all factor payments. This is the income method.
The aggregate spending of the economy (measured at A) must equal the aggregate income earned by factors of production (measured at C). And both must equal the value of output (measured at B). The flows are equal at all three points.
The three methods — product, income, and expenditure — always yield the same estimate of national income. This is not an assumption; it follows from the circular nature of income flows. Whatever is produced generates an equal amount of income, and that income is spent to purchase what was produced.
A Paradox: Spending Beyond Current Income
The textbook presents an interesting thought experiment. Suppose households decide to spend more than their current income — perhaps by borrowing. What happens?
If households spend more, firms face higher demand. To meet this extra demand, firms produce more goods and services. To produce more, firms must pay additional factor payments (wages, interest, etc.) to the factors of production. How much extra? Exactly equal to the value of the additional goods and services being produced.
So households, by spending more, cause their own incomes to rise by exactly the amount needed to sustain that higher spending. An economy can decide to spend more than its present level of income, and by doing so, its income will eventually rise to a level consistent with the higher spending.
This seems paradoxical because it contradicts individual experience. A single worker cannot decide to spend more and thereby cause her own income to rise equivalently. But for the economy as a whole, because income circulates, a rise in the flow at one point eventually raises the flow at all points. This is a classic example of how the behaviour of a single agent differs from the behaviour of the aggregate economy. …