Economics · Ch 8 — Theory of Consumer Behaviour
Budget Set and Budget Line
Budget Set and Budget Line
The Budget Constraint: What the Consumer Can Afford
A consumer's choices are not unlimited. She is constrained by two things: her income and the prices of the goods she wants to buy. This section introduces the formal way economists describe this constraint.
Suppose a consumer has a fixed income, denoted by . She wants to buy two goods: bananas and mangoes. Let the price of bananas be per unit, and the price of mangoes be per unit. If she buys units of bananas, she spends rupees. If she buys units of mangoes, she spends rupees. The total amount she spends on the bundle is therefore .
She can only buy a bundle if its total cost does not exceed her income. This gives us the fundamental condition:
This inequality is called the budget constraint. It defines the boundary of what is financially possible for the consumer.
The budget constraint is not a choice; it is a fact of the market. The consumer must live within it.
The Budget Set: All Affordable Bundles
The budget set is the collection of all bundles that satisfy the budget constraint. It is the set of every possible combination of bananas and mangoes the consumer can buy with her income, given the prices.
Example 2.1
A consumer has Rs 20. Both bananas and mangoes cost Rs 5 each and are available only in whole units (indivisible). The budget set is all bundles satisfying . The affordable bundles are:
(0,0), (0,1), (0,2), (0,3), (0,4), (1,0), (1,1), (1,2), (1,3), (2,0), (2,1), (2,2), (3,0), (3,1), (4,0).
The bundles (0,4), (1,3), (2,2), (3,1) and (4,0) cost exactly Rs 20; all the others cost less. Bundles like (3,3) or (4,5) cost more than Rs 20 and are not in the budget set.
In this example, goods are indivisible (you cannot buy half a banana). In reality, many goods like rice or milk are divisible. When goods are perfectly divisible, the budget set includes all points on or below the budget line, not just the integer points.
The Budget Line: The Boundary of Affordability
The budget line is the set of all bundles that cost exactly the consumer's entire income. Its equation is:
This line forms the outer boundary of the budget set. Any point on the line uses up all of the consumer's income. Any point below the line costs less than her income, leaving some money unspent.
We can rewrite this equation in the standard form of a straight line (). Solving for :
This form reveals three key features of the budget line:
- Vertical Intercept: . This is the quantity of mangoes the consumer can buy if she spends her entire income on mangoes (i.e., ).
- Horizontal Intercept: . This is the quantity of bananas she can buy if she spends her entire income on bananas (i.e., ).
- Slope: . The slope is negative, reflecting the trade-off between the two goods.
Budget Line Equation:
Slope of the Budget Line:
The Slope and the Rate of Trade-off
The slope of the budget line has a crucial economic meaning. Its absolute value, , tells us the rate at which the consumer can substitute one good for another in the market.
Think about it: Suppose the consumer is on the budget line, spending all her income. She wants one more banana. A banana costs rupees. To get that extra banana, she must reduce her spending on mangoes by exactly rupees. With that saved money, how many mangoes can she buy? Since each mango costs rupees, she can buy mangoes.
Therefore, to get one more banana, she must give up mangoes. This is the market's "exchange rate" between the two goods.
The slope of the budget line is , not . A common mistake is to invert the price ratio. Remember: the slope tells you how many mangoes (on the vertical axis) you lose for each extra banana (on the horizontal axis). The price of the good on the horizontal axis () goes in the numerator.
Diagrammatic Representation
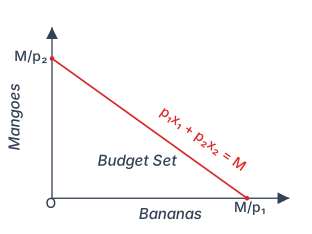
Imagine a graph with the quantity of bananas () on the horizontal axis and the quantity of mangoes () on the vertical axis.
- The budget line is a straight, downward-sloping line. It hits the vertical axis at and the horizontal axis at .
- The budget set is the entire shaded area that includes the budget line itself and all points below it (the triangle formed by the axes and the budget line). Any point in this area is affordable.
- Any point above the budget line is unaffordable. …
Drawn by us to help you understand the concept clearly, and verified to make sure it's accurate. For exams, practice from your textbook's own diagram.
The figure plots mangoes on the vertical axis and bananas on the horizontal axis. Every point in the diagram is a bundle — a specific combination of bananas and mangoes.
A single straight line runs diagonally across the graph, sloping downward from left to right. This is the budget line. Its equation is written directly on the line: . The line hits the vertical axis at the height — that is the maximum mangoes the consumer can buy if she spends all her income on mangoes (zero bananas). It hits the horizontal axis at — the maximum bananas she can buy if she spends everything on bananas (zero mangoes). These two intercepts are the extreme bundles on the budget line.
The entire triangular region on and below this line is shaded or labelled as the Budget Set. This region includes:
- All points on the budget line (bundles that cost exactly ).
- All points below the budget line (bundles that cost strictly less than ).
Points above the line lie outside the budget set — the consumer cannot afford them. …
Drawn by us to help you understand the concept clearly, and verified to make sure it's accurate. For exams, practice from your textbook's own diagram.
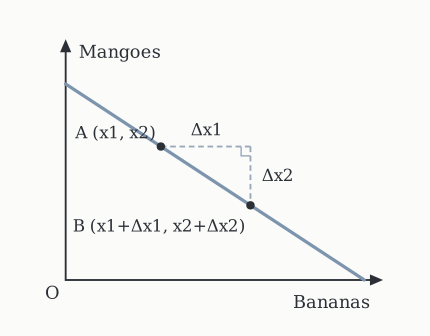
Moving from one point on the budget line to another, the extra bananas bought () and the mangoes given up () trade off at the fi …