Economics · Ch 5 — Measures of Central Tendency
Discrete Series
Discrete Series
In a discrete series each value carries a frequency, and the median item — the item — is located using the cumulative frequency. The value against the cumulative frequency that first reaches (or exceeds) this position is the median.
Example. Incomes and number of persons:
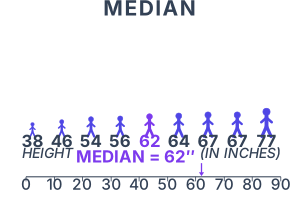
Drawn by us to help you understand the concept clearly, and verified to make sure it's accurate. For exams, practice from your textbook's own diagram.
The figure in the NCERT textbook is a simple, uncluttered diagram that shows a horizontal line with several points marked on it. The line represents a sorted data set — values arranged from smallest to largest. Along this line, three specific points are labelled: the first value, the last value, and the middle value. The middle value is highlighted as the median.
The horizontal axis is the number line itself, carrying the data values. There is no vertical axis; the figure is a one-dimensional plot. The key visual feature is that the median sits exactly in the centre of the ordered list, with an equal number of observations to its left and to its right. The diagram makes this symmetry obvious: the distance from the first value to the median is the same as the distance from the median to the last value only when the data are perfectly symmetric, but the figure is meant to show the positional centre, not the arithmetic centre.
The physical idea the figure teaches is that the median is a positional average. It does not depend on the magnitude of every value — only on their order. If the smallest value were made even smaller, or the largest value even larger, the median would not budge, as long as the middle observation stays the same. This is the core contrast with the mean, which is pulled by extreme values.
The textbook uses this figure to introduce the formula for the median of an ungrouped data set. For observations arranged in ascending order, the median is the value of the observation.
Here, is the total number of observations. The expression gives the rank (position) of the median in the ordered list, not the median value itself. For example, if , the median is the value at position , i.e., the fourth observation when the data are sorted. If is even, say , the formula gives , meaning the median lies halfway between the fourth and fifth observations — the average of those two middle values. …
| Income (Rs) | Persons (f) | Cumulative frequency (cf) |
|---|---|---|
| 10 | 2 | 2 |
| 20 | 4 | 6 |
| 30 | 10 | 16 |
| 40 | 4 | 20 |
| Total | 20 |