Chemistry · Ch 6 — Equilibrium
Effect of Temperature Change
Effect of Temperature Change
Temperature Changes: A Different Kind of Disturbance
When you change the concentration, pressure, or volume of a system at equilibrium, the equilibrium constant itself does not change. Instead, the reaction quotient becomes unequal to , and the system shifts to restore equality. Temperature is fundamentally different. A change in temperature actually changes the value of the equilibrium constant itself. This is because temperature directly affects the relative rates of the forward and reverse reactions, and these rates are governed by the activation energies, which in turn depend on the enthalpy change of the reaction.
The direction of the change in with temperature is determined entirely by the sign of for the reaction.
For an exothermic reaction (), the equilibrium constant decreases as temperature increases.
For an endothermic reaction (), the equilibrium constant increases as temperature increases.
This is a direct consequence of Le Chatelier's principle applied to temperature: if you add heat (raise temperature), the system shifts in the direction that absorbs heat. For an exothermic reaction, heat is a product, so the system shifts left (towards reactants), decreasing the product concentration and thus . For an endothermic reaction, heat is a reactant, so the system shifts right (towards products), increasing .
The Ammonia Synthesis Example
Consider the Haber process for ammonia production:
This reaction is strongly exothermic. According to Le Chatelier's principle, raising the temperature shifts the equilibrium to the left (towards and ), decreasing the equilibrium concentration of ammonia. Therefore, a low temperature is thermodynamically favourable for a high yield of ammonia.
However, there is a practical catch. At very low temperatures, the reaction rate becomes extremely slow. The system would take an impractically long time to reach equilibrium. This is a classic conflict between thermodynamics (which favours low temperature for yield) and kinetics (which favours high temperature for speed). The industrial solution is to use a catalyst (like iron with promoters) which speeds up the reaction without affecting the equilibrium position, allowing the process to run at a moderately high temperature (around 700 K) to achieve a reasonable rate while still obtaining a decent yield.
Do not confuse the effect of temperature on the equilibrium constant with its effect on the rate of reaction. Temperature always increases the rate of both forward and reverse reactions (by providing more molecules with energy above the activation barrier). However, it changes the equilibrium constant only because it increases the rate of the endothermic direction more than the exothermic direction.
Experimental Demonstration: The – Equilibrium
The effect of temperature on equilibrium can be vividly demonstrated using nitrogen dioxide gas.
is a brown gas, while its dimer is colourless. The reaction is exothermic in the forward direction (dimerisation).
The Experiment:
- Prepare gas (e.g., by adding copper turnings to concentrated ).
- Collect the gas in two identical, sealed test tubes, ensuring the same intensity of brown colour in each.
- Place both test tubes in a beaker of water at room temperature (Beaker 2) for 8–10 minutes to establish equilibrium.
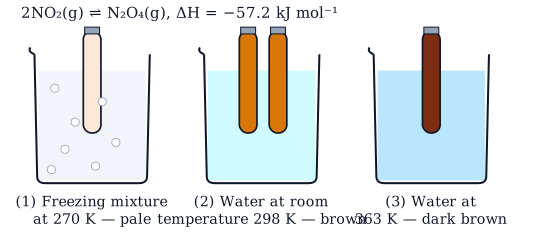
- Then, place one test tube in a freezing mixture (Beaker 1, low temperature) and the other in hot water at about 363 K (Beaker 3, high temperature).
Observations and Explanation:
- In the freezing mixture (Beaker 1): The brown colour fades (becomes lighter). The low temperature favours the exothermic forward reaction (formation of colourless ). The equilibrium shifts to the right.
- In the hot water (Beaker 3): The brown colour intensifies (becomes darker). The high temperature favours the endothermic reverse reaction (formation of brown ). The equilibrium shifts to the left.
This experiment directly shows that for an exothermic reaction, increasing temperature shifts the equilibrium towards the reactants, and decreasing temperature shifts it towards the products.
Drawn by us to help you understand the concept clearly, and verified to make sure it's accurate. For exams, practice from your textbook's own diagram.
What Figure 6.9 Actually Shows
The figure is not a graph with axes — it is a photograph or diagram of three identical sealed test tubes, each containing the same equilibrium mixture of brown NO₂ gas and colourless N₂O₄ gas. The tubes are immersed in three separate water baths at different temperatures: 270 K (freezing mixture), 298 K (room temperature), and 363 K (hot water). The only thing that changes between the tubes is the temperature; the total amount of gas and the volume are the same.
The visual message is immediate and striking. The tube at 270 K is nearly colourless — almost all the NO₂ has dimerised into N₂O₄. The tube at 298 K shows a moderate brown colour. The tube at 363 K is deep brown, meaning the equilibrium has shifted strongly toward NO₂. The figure therefore demonstrates, in a single glance, that temperature changes the position of equilibrium and that the direction of the shift depends on whether the forward reaction is exothermic or endothermic.
The Physical Idea
The reaction is:
The negative tells you the forward reaction (dimerisation) releases heat — it is exothermic. Le Chatelier’s principle says that if you add heat (raise temperature), the system will shift in the direction that absorbs heat, which is the reverse (endothermic) direction. That is exactly what happens: at 363 K the equilibrium moves left, producing more brown NO₂. At 270 K, heat is removed, so the system shifts right to produce more heat, forming colourless N₂O₄.
A common mistake is to think that temperature changes affect equilibrium the same way as concentration changes. They do not. Changing concentration or pressure changes but not ; changing temperature actually changes the value of itself. Figure 6.9 is a direct visual proof of that fact — the equilibrium composition is different at each temperature because is different.
The Key Formula the Figure Leads To
Beyond the textbook (a useful enrichment for competitive exams), this experiment naturally leads to the van’t Hoff equation, which gives the exact temperature dependence of the equilibrium constant:
Here:
- and are the equilibrium constants at absolute temperatures and (in kelvin).
- is the standard enthalpy change for the reaction (in J mol⁻¹).
- is the gas constant.
For an exothermic reaction (), the right-hand side is negative when , so and — the equilibrium constant decreases as temperature rises. That is exactly what the colour change in Figure 6.9 shows: at higher temperature, is smaller, so the equilibrium mixture contains less N₂O₄ and more NO₂.
You do not need to memorise the van’t Hoff equation for every problem — but you must remember the sign rule: exothermic reactions have smaller at higher temperatures; endothermic reactions have larger at higher temperatures. Figure 6.9 is the classic demonstration of that rule for an exothermic case.
Why This Figure Matters for Exams …
Experimental Demonstration: An Endothermic Reaction
The effect of temperature can also be seen in an endothermic reaction involving cobalt complexes:
…