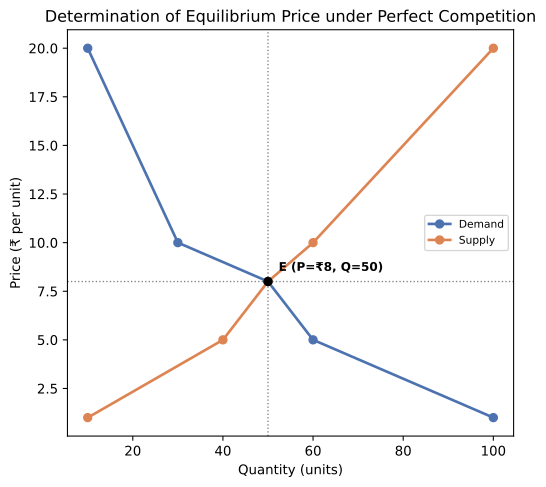
Q.From following table, draw the diagram of determination of equilibrium price under perfect competition-
Price (₹ per Unit): 1, 5, 8, 10, 20
Demand (Units): 100, 60, 50, 30, 10
Supply (Units): 10, 40, 50, 60, 100
🔒You're viewing a preview — the full solution, concept, methods & PYQ mapping are locked.
🔒 Start your 14-day free trial to unlock the full solution →Concept understanding — Market Equilibrium
Market Equilibrium: Where Buyers and Sellers Agree
Think of a busy vegetable market on a Saturday morning. Sellers have piled up tomatoes, potatoes, and onions. Buyers walk around, inspecting, bargaining. Some sellers price their tomatoes at ₹40 per kg; hardly anyone stops. Another seller keeps them at ₹20 per kg — a crowd forms, and within an hour, her stock is gone.
What you just witnessed is the market searching for a price that works for both sides. That price — where neither a pile of unsold tomatoes remains nor a long queue of disappointed buyers — is the equilibrium price.
The Precise Meaning
Market equilibrium is a state where the quantity that buyers want to buy (demand) exactly equals the quantity that sellers want to sell (supply) at the prevailing price. At this point, there is no tendency for the price to change — unless something outside the market shifts.
Qd=Qs
Where:
- Qd = Quantity demanded (what consumers wish to purchase at a given price)
- Qs = Quantity supplied (what producers wish to sell at that price)
This is the only price where the plans of all buyers and all sellers are consistent. No one is forced into an unwanted situation.
Why It Matters
Without equilibrium, markets are unstable. If price is above equilibrium, sellers produce more than buyers want — a surplus (excess supply). Unsold goods pile up, and sellers start cutting prices to clear stock. If price is below equilibrium, buyers want more than sellers produce — a shortage (excess demand). Queues form, and sellers realise they can raise prices.
The market automatically pushes toward equilibrium through price changes. This self-correcting mechanism is what Adam Smith called the "invisible hand." It means that in a free market, resources are allocated without a central planner telling anyone what to do.
NCERT Class-12 Macroeconomics (Chapter 5) defines equilibrium as: "A situation where aggregate demand equals aggregate supply." The same logic applies to a single market (micro) or the whole economy (macro).
A Diagram in Words
Picture a standard graph:
- The demand curve slopes downward (as price falls, quantity demanded rises).
- The supply curve slopes upward (as price rises, quantity supplied rises).
- They cross at one point — the equilibrium point.
Draw a vertical line from that point to the price axis: that's the equilibrium price. Draw a horizontal line to the quantity axis: that's the equilibrium quantity. The two curves meet only once because demand and supply move in opposite directions with price.
What NCERT Says (Class-12, Microeconomics, Chapter 5)
The textbook states clearly:
"Equilibrium price is the price at which the quantity demanded equals the quantity supplied. Equilibrium quantity is the quantity bought and sold at that price."
It also introduces two key terms:
- Excess demand — when Qd>Qs at a price below equilibrium. Competition among buyers pushes price up. …
Equilibrium under perfect competition occurs exactly where quantity demanded equals quantity supplied at a given price; scanning the given schedule shows this happens at ₹8.
…
From the given schedule, demand equals supply (both = 50 units) at price ₹8 — that is the equilibrium point.
Tabulate the data:
Price (₹): 1, 5, 8, 10, 20
Demand (units): 100, 60, 50, 30, 10
Supply (units): 10, 40, 50, 60, 100
At ₹1, demand (100) far exceeds supply (10) — excess demand of 90 units pushes price up. At ₹5, demand (60) still exceeds supply (40) — excess demand of 20 units, price keeps rising. At ₹8, demand (50) exactly equals supply (50) — no excess demand or supply, so price has no further tendency to change: this is the equilibrium. At ₹10, supply (60) exceeds demand (30) — excess supply of 30 pushes price back down. At ₹20, supply (100) far exceeds demand (10) — a large excess supply, price falls further.
…
- CBSE 2025Set ANNUAL1 markMCQQ.Into how many periods has Marshall divided production time on the basis of supply? (A) Two (B) Three (C) Four (D) Seven
›Reveal solutionSolution
Marshall divided production/supply time into FOUR periods, so the answer is (C) Four.
In the Marshallian treatment of price determination, supply cannot react instantly; how much it can adjust depends on the time allowed. On this basis Marshall recognised four time periods: (1) the market or very short period (supply is fixed), (2) the short period (supply varies only by changing variable factors), (3) the long period (all factors variable, firms can enter/exit), and (4) the very long or secular period (even technology and population change). Thi …
- CBSE 2025Set ANNUAL1 markMCQQ.Market price is found in (A) Very short period market (B) Long period market (C) Very long period market (D) None of these
›Reveal solutionSolution
Market price is a very-short-period phenomenon, so the answer is (A) Very short period market.
Marshall distinguished market price from normal price. Market price is the actual price on a given day, determined when the stock of the good is fixed and supply cannot respond; demand is the dominant force, so the price can fluctuate sharply. In the long and very long periods supply fully adjusts and the price tends towards the nor …
- CBSE 2025Set ANNUAL1 markMCQQ.In equilibrium situation (A) The amount to be sold is equal to the amount to be purchased (B) Market supply is equal to market demand (C) Neither the firm nor the consumer wants to be destabilised (D) All of these
›Reveal solutionSolution
Every option describes equilibrium, so the answer is (D) All of these.
Equilibrium is a state of rest. At the equilibrium price the amount buyers want to purchase exactly equals the amount sellers want to sell, so market demand equals market supply, and neither firms nor consumers have any incentive to change their plans (no force pushing price up or down). Statements (A), (B …
- CBSE 2025Set ANNUAL1 markMCQQ.Price of a good is determined at a point where (A) Demand of the commodity is high (B) Supply of the commodity is high (C) Demand of the commodity and supply of the commodity are equal (D) None of these
›Reveal solutionSolution
Equilibrium price is set where demand equals supply, so the answer is (C).
In a competitive market the price is determined at the intersection of the demand and supply curves — the point where the quantity consumers are willing to buy equals the quantity producers are willing to sell. If demand merely being high (A) or supply being high (B) decided price, there would be persistent surpluses or shortages; price actually adjusts until the two are equal. This demand-supp …
- CBSE 2024Set MARCH1 markQ.Define market equilibrium.
›Reveal solutionSolution
Market equilibrium is the state where quantity demanded equals quantity supplied, so there is no tendency for price to change.
Market equilibrium refers to a situation in the market where the quantity that buyers are willing to buy is exactly equal to the quantity that sellers are willing to sell at the prevailing price (QD=QS). At this point there is neither excess demand nor excess supply, so the market price and quantity have no tendency to change until demand o …
- CBSE 2024Set ANNUAL1 markMCQQ.The price of a good is determined by (A) Demand (B) Supply (C) Both Demand and Supply (D) Government
›Reveal solutionSolution
Market price is set where demand and supply balance, so the answer is (C) Both Demand and Supply.
A central idea of the BSEB Inter / Class-12 Commerce Economics syllabus (aligned with the NCERT/CBSE micro curriculum) is that in a free, competitive market price is determined by the interaction of the market demand and the market supply for a good. Demand alone cannot fix price (buyers would want the lowest price), and supply alone cannot fix it either (sellers would want the highest). The price settles at the level where quantity demanded equals quantity supplied — the equilibrium price.
…
- CBSE 2024Set ANNUAL1 markMCQQ.Price of goods is determined at a point where (A) Demand of goods > Supply of goods (B) Demand of goods < Supply of goods (C) Demand of goods = Supply of goods (D) None of these
›Reveal solutionSolution
Market price is finally determined at the equilibrium point where quantity demanded = quantity supplied, so the answer is (C).
In the BSEB Inter / Class-12 Commerce Economics syllabus, the equilibrium price is defined as the price at which market demand equals market supply. At any price above equilibrium, supply exceeds demand (excess supply/surplus), and competition among sellers pushes the price down. At any price below equilibrium, demand exceeds supply (excess demand/shortage), and competition among buyers pushes the price up. These forces stop on …
- CBSE 2024Set ANNUAL1 markQ.Fill in the blank: ______ refers to a state of balance (equilibrium).
›Reveal solutionSolution
The word for a state of balance is equilibrium.
Equilibrium refers to a position of rest or balance from which there is no tendency to move, because the opposing forces acting on it are exactly equal. In a market, equilibrium occurs where the quantity demanded equals the quantity supplied, determining the equilibrium …
- CBSE 2023Set ANNUAL1 markQ.Fill in the blank: ______ price is a fluctuating phenomenon.
›Reveal solutionSolution
Market price is a fluctuating phenomenon.
The market price is the price prevailing in the market at a particular moment, determined by the current (short-run) forces of demand and supply. Because these forces change frequently, the market price keeps fluctuating from time to time. In contrast, the normal (long-run) price i …
- CBSE 2022Set MARCH1 markQ.Define Market equilibrium.
›Reveal solutionSolution
Market equilibrium: quantity demanded = quantity supplied, so price is stable.
A market is in equilibrium at the price at which the amount buyers wish to buy exactly equals the amount sellers wish to sell. At this equilibrium price there is neither excess demand nor excess supply, so there is no pressure on price to rise or fall. The corresponding quantity is the equilibrium quantity.
…
- CBSE 2020Set ANNUAL1 markMCQQ.A market is in a state of equilibrium when the demand for a commodity(a) is less than the supply of the commodity(b) is more than the supply of the commodity(c) is equal to the supply of the commodity(d) is unrelated to the supply of the commodity
›Reveal solutionSolution
A market is in equilibrium when quantity demanded equals quantity supplied, so the answer is (c).
Equilibrium in a market is the price–quantity combination at which there is neither excess demand nor excess supply. At the equilibrium price the amount that buyers wish to purchase is exactly equal to the amount that sellers wish to sell, so there is no tendency for the price to change.
…
🎓Unlock everything free for 14 days
- ✓Full step-by-step solutions
- ✓Concept-first explanations
- ✓Methods, shortcuts & mistakes
- ✓PYQ mapping + timed mock tests
Full access for 14 days. No credit card required.