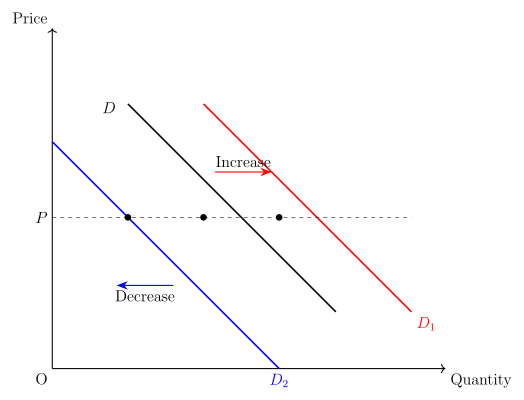
Q.What is demand curve? How does the demand curve shift? Explain with diagram.
🔒You're viewing a preview — the full solution, concept, methods & PYQ mapping are locked.
🔒 Start your 14-day free trial to unlock the full solution →Concept understanding — Supply And Demand Shift
The Everyday Intuition: Why Did My Chai Cost More Last Month?
Think about the chai-wala near your school. One month, a sudden cold wave hits your city. Everyone wants hot chai. The chai-wala can only make so many cups per hour. What happens? He might raise the price from ₹10 to ₹12. You grumble, but you still buy it because you're cold. That's demand shifting — more people wanting chai at every price.
Now imagine a different scenario: a truckers' strike makes milk and sugar expensive to transport. The chai-wala now has to pay more for his ingredients. He can't afford to sell chai at ₹10 anymore. He raises the price to ₹12 just to cover his costs. That's supply shifting — the cost of making chai has changed.
These two stories feel similar — price goes up in both — but the reason is completely different. And that difference is the entire point of this concept.
The Precise Meaning: What "Shift" Actually Means
In economics, demand and supply are not single numbers. They are schedules — a whole list showing how much buyers want (or sellers offer) at every possible price. We draw them as curves on a graph: price on the vertical axis, quantity on the horizontal.
A shift means the entire curve moves — left or right. This is different from a movement along the curve, which happens when only the price changes.
Shift of the curve = a non-price factor changes (income, tastes, input costs, technology).
Movement along the curve = only the price changes.
Demand Shift
The demand curve shows: "At price ₹P, buyers want quantity Q." If something other than price changes how much people want, the whole curve shifts.
Rightward shift (increase in demand): At every price, buyers want more than before.
Leftward shift (decrease in demand): At every price, buyers want less.
What causes a demand shift? NCERT Class 12 (Introductory Microeconomics, Chapter 5) lists these factors:
- Change in income: For normal goods, higher income → more demand at every price. For inferior goods (like cheap noodles), higher income → less demand.
- Change in tastes/preferences: A health report praising green tea shifts its demand curve right.
- Change in price of related goods:
- Substitutes (tea and coffee): If coffee becomes expensive, tea demand shifts right.
- Complements (petrol and cars): If petrol becomes expensive, car demand shifts left.
- Expectations about future prices: If you think chai will cost ₹15 next week, you buy more today — demand shifts right now.
- Number of buyers: More population → more demand at every price.
Supply Shift
The supply curve shows: "At price ₹P, sellers offer quantity Q." If something other than price changes their willingness or ability to sell, the whole curve shifts.
Rightward shift (increase in supply): At every price, sellers offer more.
Leftward shift (decrease in supply): At every price, sellers offer less.
NCERT lists these causes:
- Change in input prices: Cheaper raw materials → supply shifts right. Costlier inputs → supply shifts left.
- Change in technology: Better machines → produce more at same cost → supply shifts right.
- Change in price of other goods (for multi-product firms): If a farmer can grow wheat or rice, and wheat price rises, they shift land to wheat — rice supply shifts left.
- Expectations: If sellers expect higher prices next month, they may hold back stock today — supply shifts left.
- Number of sellers: More firms enter the market → supply shifts right.
- Taxes and subsidies: A tax on production shifts supply left (costs rise). A subsidy shifts supply right (costs fall).
Why It Matters: The New Equilibrium
The market price is determined where demand and supply curves intersect. That intersection is called equilibrium. When a curve shifts, the equilibrium changes.
Here is what happens in words (and you should draw this):
Case 1: Demand shifts right (increase in demand)
- At the old price, there is now excess demand — buyers want more than sellers offer.
- Sellers raise price. As price rises, some buyers drop out, and sellers produce more.
- New equilibrium: Higher price, higher quantity. …
The demand curve plots the inverse relationship between a good's price and quantity demanded, and it moves to an entirely new position whenever a factor OTHER than the good's own price changes.
…
The demand curve plots price against quantity demanded (downward sloping); it SHIFTS due to non-price factors like income, tastes, and related-goods' prices.
On a diagram with price on the Y-axis and quantity demanded on the X-axis, the demand curve DD slopes downward, reflecting the Law of Demand. This curve is drawn for GIVEN levels of income, tastes, and prices of related goods — it shows ONLY how quantity demanded responds to the good's OWN price, with everything else constant.
If any of these 'everything else' factors changes, the ENTIRE curve shifts to a new position (a movement different from simply sliding along the same curve due to a price change):
- A rise in income (for a normal good), a rise in the price of a substitute, a fall in the price of a complement, a favourable change in taste, or an expectation of a future price rise — each shifts the demand curve RIGHTWARD (an increase in demand: more is demanded at every price). …
- CBSE 2026Set ANNUAL1 markMCQQ.Demand curve generally slopes -(a) upward from left to right(b) downward from left to right(c) Parallel to X-Axis(d) Parallel to Y-Axis(a) upward from left to right(b) downward from left to right(c) Parallel to X-Axis(d) Parallel to Y-Axis
›Reveal solutionSolution
The demand curve slopes downward from left to right (negative slope).
With price on the Y-axis and quantity demanded on the X-axis, the standard demand curve slopes downward, reflecting the Law of Demand: other things (income, tastes, prices of related goods) remaining constant, consumers buy more of a good when it is cheaper and less when it is costlier — due to the substitution effect, income effect, and (in the cardinal-utility view) the law of diminishing marginal utility. 'Upward sloping' would represent the rare exceptions (Gi …
- CBSE 2025Set MARCH1 markMCQQ.The figure shows the leftward shift of demand curve. Identify the cause of the shift from the following :(a) Price of the product increases(b) Price of the product decreases(c) Income of the consumer decreases(d) Income of the consumer increases
›Reveal solutionSolution
A leftward shift of demand for a normal good is caused by a fall in consumer income — option (c).
…
- CBSE 2025Set ANNUAL1 markMCQQ.Which of the following is the reason for a decrease in supply? (A) Increase in production cost (B) Increase in the prices of substitutes (C) Fall in number of firms in the industry (D) All of these
›Reveal solutionSolution
All the listed factors reduce supply, so the answer is (D) All of these.
Supply falls (the curve shifts left) for several reasons. A rise in the cost of production makes each unit less profitable, so firms supply less (A). A rise in the prices of substitutes in production tempts producers to switch resources to those other goods, cutting the supply of this good (B). A fall in the number of firms in the industry directly lowers tot …
- CBSE 2025Set ANNUAL1 markMCQQ.If demand and supply curves both shift to the right, the equilibrium price will - (A) Increase (B) Decrease (C) Remain unchanged (D) Any of the above
›Reveal solutionSolution
A simultaneous rightward shift of demand and supply raises quantity but leaves the price change indeterminate, so (D) is correct.
In the RBSE/CBSE Class-12 market-equilibrium chapter, when BOTH the demand curve and the supply curve shift to the right:
- Quantity — unambiguously increases (both shifts push quantity up).
- Price — the two shifts pull in opposite directions. A rightward demand shift tends to raise price, while a rightward supply shift tends to lower it.
The net effect on price therefore depends on the relative size of the two shifts:
- If demand shifts more than supply → price rises.
- If supply shifts more than demand → price falls. …
- CBSE 2025Set ANNUAL1 markMCQQ.If an increase in quantity demanded is equal to an increase in quantity supplied than equilibrium price and equilibrium quantity will show ______ .(a) Price increases quantity remains constant(b) Quantity decreases and price remains constant(c) Price decreases and quantity remains constant(d) Quantity increases and price remains constant
›Reveal solutionSolution
Equal rightward shifts of both the demand and supply curves raise the equilibrium quantity while leaving the equilibrium price unchanged.
Market equilibrium occurs where the demand curve intersects the supply curve. When a rise in demand (demand curve shifts right by Δ) is matched EXACTLY by an equal rise in supply (supply curve shifts right by the same Δ) at the original price, both curves move outward by the same horizontal distance:
- At the OLD equilibrium price, there is no longer excess demand or excess supply, because both quantity demanded and quantity supplied have risen by the same amount — so the price does not need to adjust. …
- CBSE 2024Set ANNUAL1 markQ.Fill in the blank: Increase in taxation ______ supply.
›Reveal solutionSolution
An increase in taxation decreases supply.
A tax (such as an excise or indirect tax) raises the cost of production per unit for the seller. At the existing price the producer now earns less, so at every price he is willing to supply a smaller quantity. This causes the supply curve to shift to the left — i …
- CBSE 2023Set ANNUAL1 markQ.What type of slope does a demand curve generally have?
›Reveal solutionSolution
The demand curve slopes downward (negative slope) from left to right.
This negative slope reflects the Law of Demand: holding income, tastes, and the prices of related goods constant, a higher price for a good discourages consumers from buying as much of it (due to the substitution effect, income effect, and diminishing marginal utility of successive units), while a lower price encourages them to buy more. Plotted with price on the Y-axis and quantity demanded on the X-axis, this gives a curve sloping downward from the upper-left to the lower-right. (A small number of exceptions — Veblen/prestige goods …
- CBSE 2020Set MARCH1 markMCQQ.Which of the following causes rightward shift of the supply curve ?(a) Rise in input price(b) Technological progress(c) Imposition of unit tax(d) None of these
›Reveal solutionSolution
Technological progress causes a rightward shift of the supply curve.
…
- CBSE 2020Set ANNUAL1 markQ.Write the name of two perishable goods.
›Reveal solutionSolution
Perishable goods spoil quickly and cannot be stored long — e.g. milk and vegetables.
Perishable goods are commodities that decay or lose their usefulness in a short time and therefore cannot be stored for long periods; they have to be consumed or sold quickly. Because their supply cannot be easily held back, their market price is often very sensitive to day-to-day changes in supply and demand.
Two clear examples are:
- Milk — spoils within a day or two without refrigeration. …
- CBSE 2020Set ANNUAL1 markQ.Define 'change in demand'.
›Reveal solutionSolution
Change in demand = a shift of the whole demand curve due to non-price factors.
Demand for a good depends on its own price and on other determinants: income, tastes and preferences, prices of related (substitute/complementary) goods, and expectations. 'Change in quantity demanded' refers only to movement ALONG a fixed demand curve when the good's own price changes. 'Change in demand', by contrast, means the entire curve shifts to a new position because one of the non-price determinants changes — e.g., a rise in income shifts the demand curve for a normal good to the right (increase in demand), while an adverse chan …
🎓Unlock everything free for 14 days
- ✓Full step-by-step solutions
- ✓Concept-first explanations
- ✓Methods, shortcuts & mistakes
- ✓PYQ mapping + timed mock tests
Full access for 14 days. No credit card required.