Economics · Ch 10 — The Theory of the Firm under Perfect Competition
Condition 3
Condition 3
4.3.3 Condition 3
The third condition for profit maximisation has two separate parts — one for the short run and one for the long run. Both parts deal with the same basic question: when should a firm shut down rather than produce? The answer depends on whether the market price covers the relevant cost.
Case 1: Short Run — Price must be greater than or equal to AVC
In the short run, a firm has fixed costs that it must pay regardless of whether it produces anything. The relevant cost for the shutdown decision is therefore the average variable cost (AVC), not the average total cost. The rule is: if the market price falls below the minimum of the AVC curve, the firm will produce zero output in the short run.
Why? Consider a firm producing at output level where the market price is lower than the AVC. The firm's total revenue at is:
This is the area of the rectangle with height and width — call it rectangle in the standard diagram.
The firm's total variable cost at is:
This is the area of the rectangle with height equal to the AVC at (call that height ) and width — rectangle .
Now, the firm's profit at is:
Since is less than AVC, the area of rectangle is strictly smaller than the area of rectangle . So the difference is negative — the firm's revenue does not even cover its variable costs.
What happens if the firm produces zero output? Then and , so profit is simply:
The firm loses only its fixed costs. But at , the loss is larger:
Since area is positive (it is the amount by which TVC exceeds TR), the loss at is greater than the loss at zero output. The firm therefore chooses to shut down — produce zero — and exit the market in the short run.
Drawn by us to help you understand the concept clearly, and verified to make sure it's accurate. For exams, practice from your textbook's own diagram.
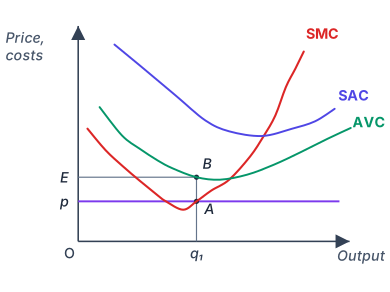
This figure is the short-run shutdown diagram. It is a single plot with the market price on the vertical axis and the firm’s output on the horizontal axis. Three curves are drawn: the firm’s short-run marginal cost curve (), its short-run average cost curve (), and its average variable cost curve (). The curve is U-shaped, and its lowest point is the minimum of . A horizontal line at price is drawn across the diagram. The key feature is that this price line lies below the minimum point of the curve — meaning the price is too low to cover even the variable cost per unit at any output level.
The physical idea is brutally simple: if the price does not cover the average variable cost at any output, every unit the firm produces adds more to cost than to revenue. Producing anything would make the loss larger than the loss from shutting down. The profit-maximising (or loss-minimising) choice in the short run is therefore to produce zero output. The firm shuts down.
The textbook uses this figure to derive the shutdown condition. For any output , the firm’s profit is , where . If the firm produces nothing, revenue is zero and total cost equals total fixed cost , so the loss is exactly . If the firm produces some , the loss is . The firm is better off producing zero whenever the loss from producing is larger than , i.e. whenever , or equivalently . Dividing by gives the condition:
If the market price is less than the average variable cost at every possible output, the firm produces nothing. The shutdown point is the minimum of the curve: the firm produces zero whenever is below that minimum.
The figure also illustrates the loss from producing at a specific output when is below . At , total variable cost is , which is the area of a rectangle with height and width . Total revenue is , a rectangle of height and width . The difference — the amount by which variable cost exceeds revenue — is the rectangle with height and width . In the figure, this rectangle is labelled with vertices , , , (where and lie on the vertical axis — at the height of — while lies on the curve at output and lies on the price line at ). The area of rectangle equals , which is exactly the extra loss beyond fixed cost that the firm would incur if it foolishly produced instead of shutting down.
A common mistake is to think the firm shuts down only when price is below average total cost. That is wrong for the short run. The firm can tolerate a price below as long as it covers , because fixed costs are sunk and must be paid regardless. The shutdown decision hinges on , not . …
A common mistake is to think that a firm should shut down whenever price is below average total cost. In the short run, the firm can still operate if price covers AVC, because fixed costs are sunk. The shutdown point is the minimum of the AVC curve, not the AC curve.
Case 2: Long Run — Price must be greater than or equal to AC
In the long run, there are no fixed costs — all costs are variable. The firm can choose its plant size and can exit the industry entirely without any sunk costs. The relevant cost for the shutdown decision is therefore the average cost (AC).
If the market price is lower than the long-run average cost at the chosen output level , the firm will not produce. Consider Figure 4.5 (the long-run analogue of Figure 4.4). At output , the firm's total revenue is:
The firm's total cost is:
Since , the area of rectangle is larger than the area of rectangle . The firm incurs a loss at .
In the long run, a firm that shuts down production has zero profit — it has no fixed costs to cover, and it can sell off its capital. So the loss from producing is worse than the zero profit from exiting. The firm will therefore exit the market.
Drawn by us to help you understand the concept clearly, and verified to make sure it's accurate. For exams, practice from your textbook's own diagram.
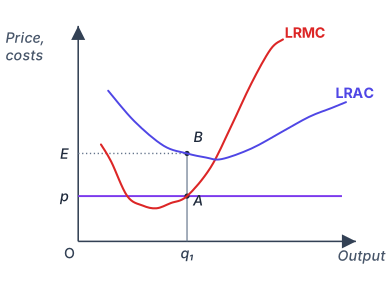
The figure plots the long-run average cost (LRAC) and long-run marginal cost (LRMC) curves of a firm against the market price, with quantity on the horizontal axis and cost/revenue per unit on the vertical axis. The LRAC curve is U-shaped, showing that average cost first falls as output increases (economies of scale), reaches a minimum point, and then rises (diseconomies of scale). A horizontal line is drawn at the market price , which is less than the minimum point of the LRAC curve. The firm’s profit-maximising output in the short run would be where marginal cost equals price, but in the long run the firm cannot cover its average costs at any positive output level.
The key physical idea is that in the long run, a firm under perfect competition must earn at least zero economic profit to stay in the market. If the market price falls below the minimum of the LRAC curve, the firm cannot produce any positive output without making a loss. The figure shows this situation: at the output level , the firm’s average cost is higher than the price. The total cost of producing units is the rectangle with height equal to the average cost at and width , while total revenue is the rectangle with height and width . The difference — the loss — is the rectangle labelled in the textbook. Because the price is below the minimum LRAC, the firm’s best decision is to produce zero output in the long run, shutting down entirely.
In the long run, a perfectly competitive firm will produce zero output if the market price is less than the minimum of its long-run average cost curve. This is the long-run shutdown condition.
The textbook uses this figure to derive the condition for long-run equilibrium of a firm under perfect competition. The central result is that in long-run equilibrium, the firm produces at the minimum point of its LRAC curve, where price equals both marginal cost and average cost. The formula for zero economic profit is:
Here, is the market price (which the firm takes as given), is long-run marginal cost, and is the lowest point on the long-run average cost curve. At this point, total revenue equals total cost, so economic profit is zero. The figure with price below minimum LRAC shows the opposite case — the firm cannot achieve this condition and must exit the industry. …
The long-run condition is stricter than the short-run condition. In the short run, the firm can survive as long as price covers AVC. In the long run, price must cover AC — otherwise the firm exits.
Summary of the Two Cases
| Time Horizon | Condition for producing | Reason |
|--------------|------------------------|--------| …