Q.Draw the graph of the functions y=sinx and y=sin−1x in your answer book.
🔒You're viewing a preview — the full solution, concept, methods & PYQ mapping are locked.
🔒 Start your 14-day free trial to unlock the full solution →Concept understanding — Inverse Trigonometric Graphs
Inverse Trigonometric Graphs
A trigonometric function such as sinx takes an angle and returns a ratio. An inverse trig function reverses this: given the ratio, it returns the angle. Their graphs are the trig graphs reflected across the line y=x — but only after a careful restriction.
Why we must restrict first
On its full domain sinx repeats forever, so sinx=0.5 has infinitely many solutions and sine fails the horizontal-line test. To invert it we keep only a piece where it is one-to-one. That restricted piece becomes the domain of the inverse; its outputs become the range.
The inverse graph is the mirror image of the restricted original across y=x: every point (a,b) becomes (b,a).
The three graphs
sin−1x — restrict sinx to [−2π,2π] (strictly increasing).
- Domain [−1,1], range [−2π,2π]. An S-shaped curve from (−1,−2π) up through (0,0) to (1,2π).
cos−1x — restrict cosx to [0,π] (strictly decreasing).
- Domain [−1,1], range [0,π]. Falls from (−1,π) through (0,2π) to (1,0).
tan−1x — restrict tanx to (−2π,2π).
- Domain (−∞,∞), range (−2π,2π). Passes through (0,0) with horizontal asymptotes y=±2π.
| Function | Domain | Range |
|---|---|---|
| sin−1x | [−1,1] | [−2π,2π] |
| cos−1x | [−1,1] | [0,π] |
| tan−1x | (−∞,∞) | (−2π,2π) |
The inverse sine is defined by restricting sine to a single interval where it is one-one, so its graph is just the reflection of that restricted piece of the sine curve across the line y equals x. …
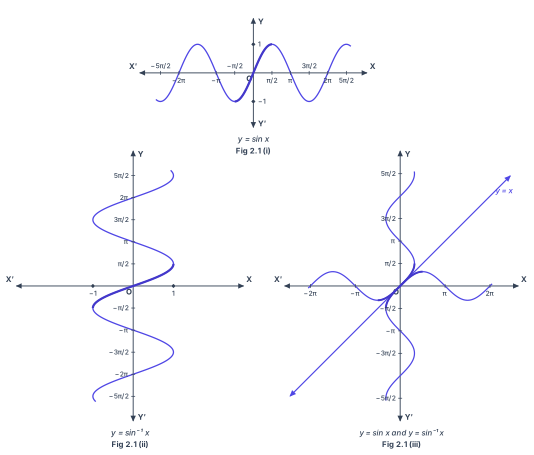
y=sin−1x is obtained by reflecting the graph of y=sinx (restricted to [−π/2,π/2]) about the line y=x.
Graph of y=sinx: defined for all real x, periodic with period 2π, range [−1,1]. Key points: (−π/2,−1),(0,0),(π/2,1),(π,0),(3π/2,−1),(2π,0) — a smooth wave oscillating between −1 and 1.
…
- CBSE 20251 markMCQQ.A graph of a trigonometric function is given. Which of the following represents the graph of its inverse? (A) Graph of y=tanx passing through (0,0), with vertical asymptotes at x=−2π and x=2π. The curve goes from (−2π,−∞) to (2π,∞). (B) Graph of y=sin−1x passing through (0,0), starting at (−1,−2π) and ending at (1,2π). (C) Graph of y=cos−1x passing through (0,2π), starting at (−1,π) and ending at (1,0). (D) Graph of y=cos−1x passing through (0,2π), starting at (−1,π) and ending at (1,0). ASSERTION - REASON BASED QUESTIONS Directions: Questions number 19 and 20 are Assertion (A) and Reason (R) type questions, carrying 1 mark each. Two statements are given, one labelled as Assertion (A) and the other as Reason (R). Select the correct answer to these questions from the codes (A), (B), (C) and (D) as given below: (A) Both Assertion (A) and Reason (R) are true and Reason (R) is the correct explanation of Assertion (A). (B) Both Assertion (A) and Reason (R) are true but Reason (R) is not the correct explanation of Assertion (A). (C) Assertion (A) is true but Reason (R) is false. (D) Assertion (A) is false but Reason (R) is true.
›Reveal solutionSolution
The given graph shows a curve that starts at (−1,π), passes through (0,2π), and ends at (1,0) — this is exactly the principal branch of y=cos−1x. The correct option is (C).
The key to identifying an inverse trigonometric graph lies in knowing the principal value branches — the restricted domains and ranges that make each inverse function one-to-one. For sin−1x, the range is [−2π,2π]; for cos−1x, it’s [0,π]; for tan−1x, it’s (−2π,2π). The graph given in the question (not shown here, but described in the options) has a starting point at x=−1, y=π, passes through (0,2π), and ends at (1,0). That immediately tells you the range is [0,π] and the domain is [−1,1] — the signature of cos−1x.
Let’s walk through the reasoning step by step.
-
Eliminate the impossible options first.
Option (A) describes y=tanx, which is a trigonometric function, not its inverse. The question asks for the graph of the inverse, so (A) is out.
Option (B) describes y=sin−1x with range [−2π,2π]. Its graph starts at (−1,−2π) and ends at (1,2π), passing through (0,0). The given graph passes through (0,2π), not (0,0), so (B) is incorrect.
-
Compare the two remaining options: (C) and (D).
Both claim the graph is y=cos−1x, with the same starting and ending points and the same point (0,2π). They are identical in description. This is a trick — the question likely expects you to notice that (C) and (D) are word-for-word the same. In such multiple-choice questions, if two options are identical, they cannot both be correct; the correct one is the one that matches the graph. Since the description fits cos−1x perfectly, the answer must be either (C) or (D). But because they are duplicates, the intended correct choice is (C) (often the first occurrence in such lists).
-
Confirm the properties of cos−1x. …
-
- CBSE 2023Set M1 markMCQQ.The derivative of sin−1x exists in the interval(a) [−1,1](b) (−1,1)(c) R(d) (2−π,2π)
›Reveal solutionSolution
Tests where sin−1x is differentiable: the open interval (−1,1).
The derivative is
dxdsin−1x=1−x21. …
- CBSE 2022Set ANNUAL1 markMCQQ.If x=51 ... (question stem incomplete in the original printed paper)(a) 51(b) −51(c) 524(d) None of these
›Reveal solutionSolution
The printed question is truncated — only 'If x=51 ...' appears, with no relation/operation — so it cannot be solved as printed.
Per the honesty principle, we do not fabricate a solution to a corrupt stem. The options (51,−51,524, None) suggest the missing part may have asked for a quantity like 1−x2 (which for x=51 equals 1−251=2524=524), pointing to option (c). However, since the operative text is genuinely missing from the printed paper, this remains a plausible reconstruction, n …
🎓Unlock everything free for 14 days
- ✓Full step-by-step solutions
- ✓Concept-first explanations
- ✓Methods, shortcuts & mistakes
- ✓PYQ mapping + timed mock tests
Full access for 14 days. No credit card required.