Economics · Ch 2 — Theory of Consumer Behaviour
Shifts in the Demand Curve
Shifts in the Demand Curve
The Assumption Behind the Demand Curve
The demand curve we studied earlier is drawn on a very specific set of assumptions. It assumes that three things are held constant: the consumer's income, the prices of other goods (related goods like substitutes and complements), and the consumer's own tastes and preferences. As long as these three factors do not change, the demand curve stays fixed. But in reality, these factors do change. When any one of them changes, the entire demand curve shifts — it moves to a new position.
Drawn by us to help you understand the concept clearly, and verified to make sure it's accurate. For exams, practice from your textbook's own diagram.
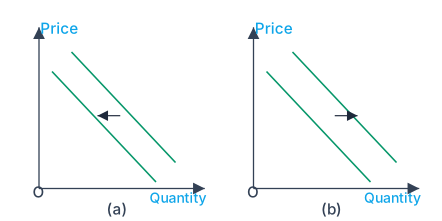
Figure 2.16 has two panels, (a) and (b), each with price on the vertical axis and quantity on the horizontal axis. In both panels, you see two downward-sloping demand curves drawn parallel to each other. The original demand curve is labelled in each panel.
In panel (a), a second demand curve, , lies to the left of . An arrow points from toward , indicating a leftward shift. This is the inward shift — at every price, the quantity demanded is now lower than before. The textbook caption calls this a "shift leftward."
In panel (b), the second demand curve, , lies to the right of . An arrow points from toward , showing a rightward shift. Here, at every price, the quantity demanded is higher. The caption calls this a "shift rightward."
The key teaching point is that a shift of the entire curve is different from a movement along the curve. A movement along a fixed demand curve happens only when the good's own price changes. A shift happens when something other than the good's own price changes — income, prices of related goods, or tastes and preferences.
The figure makes this concrete: panel (a) shows what happens when, for example, income falls for a normal good, or the price of a complementary good rises, or preferences turn unfavourable. Panel (b) shows the opposite — income rises for a normal good, the price of a substitute rises, or preferences become more favourable.
A leftward shift means less is demanded at each price; a rightward shift means more is demanded at each price. The direction of the arrow tells you which curve is the new one. …
Shift Due to Change in Income
The first factor that can shift the demand curve is a change in the consumer's income. Suppose the prices of all other goods and the consumer's preferences remain unchanged, but the consumer's income rises. What happens to the quantity demanded of a particular good at each price? The answer depends on the nature of the good.
- Normal goods: For a normal good, an increase in income leads to an increase in demand at every price. The entire demand curve shifts rightward (to the right). At the same price, the consumer now wants to buy more units.
- Inferior goods: For an inferior good, an increase in income leads to a decrease in demand at every price. The demand curve shifts leftward (to the left). At the same price, the consumer now wants to buy fewer units.
The direction of the shift — rightward or leftward — depends entirely on whether the good is normal or inferior. Income change alone does not tell you the direction; you must know the type of good.
Shift Due to Change in Price of a Related Good
The second factor is a change in the price of a related good. Related goods are of two types: substitutes and complements. The textbook uses the term "related good" to cover both.
- Substitute goods: Two goods are substitutes if they can be used in place of each other (e.g., tea and coffee, or ice-cream and cold-drink). If the price of a substitute good increases, consumers will switch away from that substitute and towards the good in question. At each price of the good, the quantity demanded rises. Hence, the demand curve shifts rightward.
- Complementary goods: Two goods are complements if they are used together (e.g., cars and petrol, or printers and ink cartridges). If the price of a complementary good increases, the consumer will buy less of the complement, and therefore also less of the good in question. At each price of the good, the quantity demanded falls. Hence, the demand curve shifts leftward.
A common mistake is to confuse the effect of a price change of a related good with a movement along the demand curve. A change in the price of a related good shifts the entire demand curve of the good in question. It does not cause a movement along the same curve.
Shift Due to Change in Tastes and Preferences
The third factor is a change in the consumer's own tastes and preferences. This is a broad category that includes changes in fashion, habits, seasons, health information, advertising, and so on.
- Favourable change: If the consumer's preferences change in favour of a good — for example, because summer arrives and people prefer ice-creams — the demand for that good increases at every price. The demand curve shifts rightward.
- Unfavourable change: If the consumer's preferences change against a good — for example, if news reveals that cold-drinks are injurious to health — the demand for that good decreases at every price. The demand curve shifts leftward.
The textbook gives two concrete examples:
- The demand curve for ice-creams is likely to shift rightward in summer because the preference for ice-creams goes up.
- The revelation that cold-drinks might be injurious to health can adversely affect preferences for cold-drinks, leading to a leftward shift in the demand curve for cold-drinks.