Chemistry · Ch 3 — Classification of Elements and Periodicity in Properties
(c) Ionization Enthalpy
(c) Ionization Enthalpy
(c) Ionization Enthalpy
Definition and Meaning
Ionization enthalpy () is a quantitative measure of the tendency of an element to lose an electron. It is defined as the energy required to remove the most loosely bound electron from an isolated gaseous atom in its ground state.
For an element X, the first ionization enthalpy () is the enthalpy change for the reaction:
Ionization enthalpy is always positive because energy must always be supplied to overcome the attraction between the electron and the nucleus. It is expressed in units of kJ mol.
Successive Ionization Enthalpies
An atom can lose more than one electron. The second ionization enthalpy () is the energy required to remove an electron from a singly charged cation:
The second ionization enthalpy is always greater than the first. This is because removing an electron from a positively charged ion requires overcoming a greater electrostatic attraction than removing one from a neutral atom. Similarly, the third ionization enthalpy is greater than the second, and so on.
Unless otherwise specified, the term "ionization enthalpy" refers to the first ionization enthalpy.
The Two Major Trends in Ionization Enthalpy
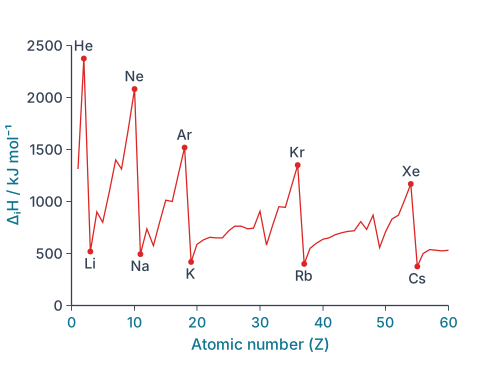
The graph of first ionization enthalpy vs. atomic number (for Z = 1 to 60) shows a clear periodic pattern. Maxima occur at the noble gases (which have stable, closed-shell electron configurations). Minima occur at the alkali metals (which have a single, easily removed valence electron).
Drawn by us to help you understand the concept clearly, and verified to make sure it's accurate. For exams, practice from your textbook's own diagram.
Fig. 3.5 is a line graph that plots the first ionization enthalpy (, in kJ mol) on the vertical axis against atomic number (, from 1 to 60) on the horizontal axis. The curve is a single, continuous saw-tooth pattern that rises and falls repeatedly as you move from left to right across the periodic table.
The most striking feature is the set of sharp peaks — the maxima — which occur at the noble gases: helium (), neon (), argon (), krypton (), and xenon (). These are the highest points on the graph because noble gases have completely filled electron shells, making them extremely stable and reluctant to lose an electron. Removing an electron from such a configuration requires a large amount of energy.
The minima occur at the alkali metals: lithium (), sodium (), potassium (), rubidium (), and caesium (). These elements have a single electron in their outermost shell, which is far from the nucleus and well-shielded by inner electrons. That electron is easy to remove, so the ionization enthalpy is low.
Between each minimum and the next maximum, the curve generally rises across a period, but not smoothly — there are small dips and irregularities (for example, at boron and oxygen in the second period) that reflect subtle effects like half-filled and fully filled subshell stability. The overall trend, however, is clear: ionization enthalpy increases across a period and decreases down a group.
The physical idea the figure teaches is that ionization enthalpy is a periodic property — it repeats in a regular pattern as atomic number increases, directly linked to the element's position in the periodic table. The maxima at noble gases and minima at alkali metals are the most reliable markers of this periodicity.
The textbook uses this figure to develop the concept of effective nuclear charge () as the key explanatory factor. The first ionization enthalpy for an element is defined by the reaction:
…
Trend 1: Ionization enthalpy generally increases across a period.
Consider the second period. The values increase from Li to Ne, with two notable exceptions (discussed below).
Why? Across a period, the atomic radius decreases and the effective nuclear charge increases. The valence electrons are held more tightly to the nucleus. Therefore, more energy is required to remove one of them.
Trend 2: Ionization enthalpy generally decreases down a group.
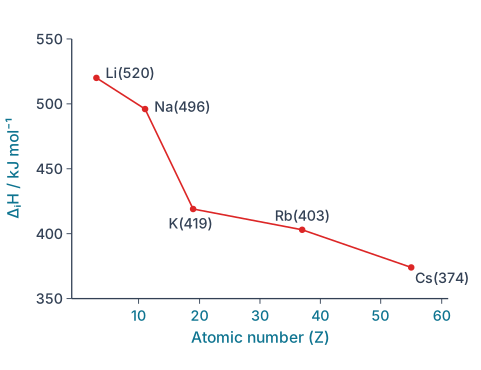
Consider the alkali metals (Group 1). The values decrease from Li to Cs.
Why? Down a group, the atomic radius increases significantly. The valence electron is farther from the nucleus and is more effectively shielded by the inner core electrons. The attraction between the nucleus and the valence electron is weaker, so less energy is needed to remove it.
Drawn by us to help you understand the concept clearly, and verified to make sure it's accurate. For exams, practice from your textbook's own diagram.
Fig. 3.6(b) plots the first ionisation enthalpy of the alkali metals (350–550 kJ mol) against atomic number: Li (520) → Na (496) → K (419) → Rb (403) → Cs (374). The curve falls steadily down the group.
Why it falls: each successive alkali metal holds its lone valence electron in a higher principal shell, farther from the nucleus, behind more filled inner shells. Distance and shielding together outweigh the growing nuclear charge, so felt by the electron shrinks and less energy is needed to remove it. …
Anomalies in the Trend Across a Period
The general increase across a period is not perfectly smooth. There are two important exceptions in the second period.
Anomaly 1: Boron (Z=5) has a lower first ionization enthalpy than Beryllium (Z=4).
- Beryllium has the electron configuration . The electron being removed is a 2s electron.
- Boron has the electron configuration . The electron being removed is a 2p electron.
A 2s electron has a higher probability of being found closer to the nucleus than a 2p electron (it has greater "penetration"). Therefore, the 2s electron in Be is more tightly bound and experiences less shielding from the inner core. The 2p electron in B is more effectively shielded by the 2s electrons and is easier to remove. Hence, the ionization enthalpy of B is lower than that of Be.
Drawn by us to help you understand the concept clearly, and verified to make sure it's accurate. For exams, practice from your textbook's own diagram.
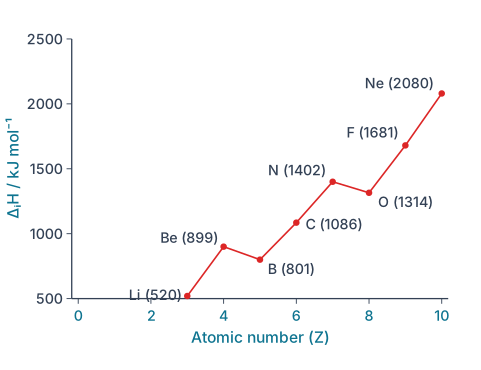
Fig. 3.6(a) plots the first ionisation enthalpy (, 500–2500 kJ mol) of the second-period elements against atomic number (0–10). Each point carries its symbol and value: Li (520), Be (899), B (801), C (1086), N (1402), O (1314), F (1681), Ne (2080). The line rises across the period — but with two famous dips.
The general rise: across the period increases (same shell, growing nuclear charge, near-constant shielding), so the outermost electron is held ever more tightly.
Dip 1 — B (801) below Be (899): beryllium's outgoing electron leaves the penetrating, filled subshell; boron's leaves the higher-energy, better-shielded orbital, which costs less.
Dip 2 — O (1314) below N (1402): nitrogen's half-filled (one electron per orbital, Hund's rule) is especially stable; in oxygen the fourth electron is paired, and that pairing repulsion makes it easier to remove. …
Anomaly 2: Oxygen (Z=8) has a lower first ionization enthalpy than Nitrogen (Z=7).
- Nitrogen has the electron configuration . According to Hund's rule, the three 2p electrons occupy three different orbitals, each singly. This is a half-filled, stable configuration.
- Oxygen has the electron configuration . One of the 2p orbitals now contains two electrons. …