Chemistry · Ch 2 — Structure of Atom
Line Spectrum of Hydrogen
Line Spectrum of Hydrogen
2.3.3b Line Spectrum of Hydrogen
When an electric discharge is passed through gaseous hydrogen, the H molecules dissociate, and the energetically excited hydrogen atoms produced emit electromagnetic radiation at discrete frequencies rather than a continuous spread. The hydrogen spectrum consists of several series of lines, each named after the scientist who discovered it.
Drawn by us to help you understand the concept clearly, and verified to make sure it's accurate. For exams, practice from your textbook's own diagram.
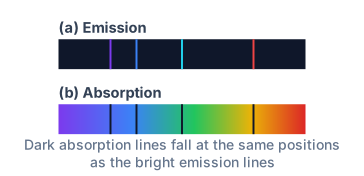
Fig. 2.10 is a side-by-side comparison of two spectra — emission on top, absorption below — that reveals a deep symmetry in how hydrogen interacts with light. The figure is not a graph with axes; it is a schematic of the actual patterns you would see on a photographic plate after light passes through a prism.
In the emission spectrum (panel a), the background is completely dark. Across this darkness you see a small number of bright, sharply defined lines — each a different colour. These lines are produced when an electric discharge excites hydrogen gas in a discharge tube; the excited atoms later emit light at specific wavelengths. That light is then sent through a slit and a prism, which spreads it into its component colours. The photographic plate records only those discrete wavelengths, so you get bright lines on a dark field.
In the absorption spectrum (panel b), the situation is reversed. Here, a continuous source of white light (covering all visible wavelengths) passes through cool, unexcited hydrogen gas before entering the prism. The photographic plate now shows a continuous rainbow — except at a few precise positions where dark lines cut across it. Those dark lines occur at exactly the same positions as the bright lines in the emission spectrum. The cool hydrogen atoms have absorbed light at those specific wavelengths, removing them from the otherwise continuous beam.
The coincidence of line positions is the key physical message: the wavelengths at which an excited hydrogen atom emits light are exactly the wavelengths at which a cool hydrogen atom absorbs light. This tells us that atoms can only exchange energy in fixed, quantised packets.
The labels in the figure guide you through the apparatus: a slit narrows the beam, a prism disperses the light, and a photographic plate (or detector) records the result. The H sample is the source of the emission or the absorbing medium, depending on the panel.
The textbook uses this experimental fact to motivate the idea that an atom has discrete energy levels. The formula that emerges from the hydrogen spectrum is the Rydberg formula:
…
The Hydrogen Spectrum: Balmer's Empirical Formula
In 1885, Johann Balmer discovered that the wavelengths of the four visible lines in the hydrogen spectrum could be described by a simple empirical formula. For the Balmer series (lines in the visible region):
where and is the Rydberg constant for hydrogen, equal to .
The Rydberg constant is often given in different units. In SI units it is . In some textbooks you may see it as — always check the units.
The Generalized Rydberg Formula
Later, Rydberg generalized Balmer's work to describe all spectral series of hydrogen. The wavenumber (the number of wavelengths per unit length, ) for any transition is:
where and are integers with .
The Spectral Series of Hydrogen
Table 2.3 lists all known spectral series for hydrogen, each corresponding to transitions ending at a particular lower energy level ():
To remember the order of the series: Lyman (UV), Balmer (Visible), Paschen, Brackett, Pfund (all IR). The first letters spell L, B, P, B, P — think "Little Boys Play Baseball Perfectly."
| Series | Spectral Region | ||
|---|---|---|---|
| Lyman | 1 | 2,3.... | Ultraviolet |
| Balmer | 2 | 3,4.... | Visible |
| Paschen | 3 | 4,5.... | Infrared |
Deriving the Energy Levels from the Spectrum
The existence of discrete spectral lines implies that the energy of the hydrogen atom is quantized. If an electron jumps from a higher energy level to a lower energy level , the energy of the emitted photon equals the energy difference:
Combining this with the Rydberg formula:
This suggests that the energy of the -th level is proportional to :
…
Drawn by us to help you understand the concept clearly, and verified to make sure it's accurate. For exams, practice from your textbook's own diagram.
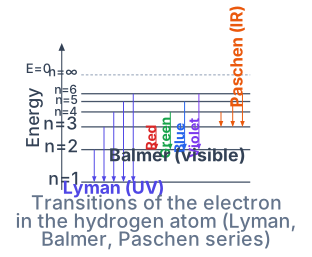
The figure is an energy-level diagram for the hydrogen atom. The vertical axis represents energy, increasing upward. Each horizontal line marks a specific energy level, labelled by the principal quantum number . The spacing between these lines decreases as increases, and the lines converge at the top to a single limit labelled , which corresponds to the ionisation limit — the energy at which the electron is completely removed from the atom.
The key physical idea is that an electron can only occupy these discrete energy levels. When it jumps from a higher level () to a lower one (), it emits a photon of light. The diagram shows these jumps as downward arrows, grouped into spectral series according to the final level :
- Lyman series: all transitions end at . These arrows start from and point down to . The emitted photons lie in the ultraviolet (UV) region.
- Balmer series: transitions end at . Arrows from down to . These photons fall in the visible region.
- Paschen series: transitions end at . Arrows from down to . These are in the infrared (IR).
- Brackett series () and Pfund series () are also shown, both in the IR.
The diagram makes clear that the energy difference between levels shrinks as increases, so the arrows for higher initial levels become shorter and closer together. This directly explains why each spectral series has a series limit — the shortest wavelength (highest energy) corresponds to the transition from down to the final level.
The energy of the emitted photon is given by the Rydberg formula:
where is the wavelength of the emitted light, is the Rydberg constant for hydrogen, is the lower energy level (the series limit), and is the higher energy level from which the electron falls ().
For the Lyman series, ; for Balmer, ; for Paschen, ; and so on. The formula shows that as increases, the term becomes smaller, so approaches a maximum value — the series limit — when (i.e., ). That limit is exactly the convergence point shown at the top of the diagram. …