Applied Mathematics · Ch 10 — Descriptive Statistics
Measures of Central Tendency
Measures of Central Tendency
When we collect data, we end up with a list of numbers that can feel overwhelming. Measures of central tendency give us a single, representative value that sits at the "center" of the data, telling us where most values tend to cluster. Instead of looking at every individual score, we ask: what is the typical value? The three main tools for this are the mean, the median, and the mode — each one captures "centrality" in a slightly different way, and choosin …
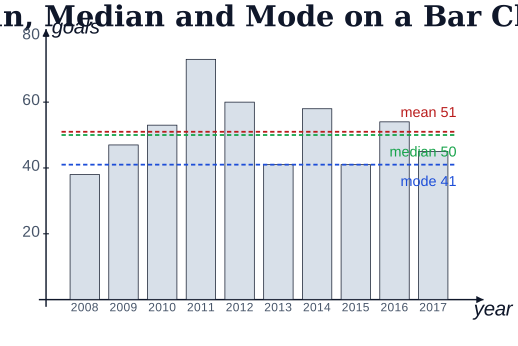
Drawn by us to help you understand the concept clearly, and verified to make sure it's accurate. For exams, practice from your NCERT textbook's own diagram.
The three measures of central tendency — mean 51, median 50 and mode 41 — marke …