Economics · Ch 16 — Comparative Development Experiences of India and Its Neighbours
Gross Domestic Product and Sectors
Gross Domestic Product and Sectors
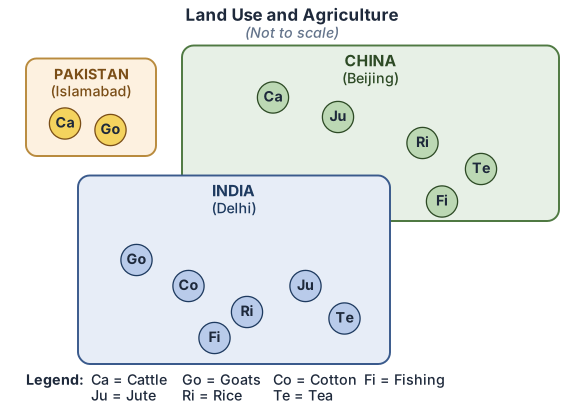
Gross Domestic Product and how it is spread across sectors show why the three economies have diverged. In purchasing-power-parity (PPP) terms China has the second largest GDP in the world, at about $22.5 trillion, whereas India's GDP (PPP) is $9.03 trillion and Pakistan's GDP is $0.94 trillion, roughly about 11 per cent of India's GDP. India's GDP is about 41 per cent of China's GDP.
Drawn by us to help you understand the concept clearly, and verified to make sure it's accurate. For exams, practice from your NCERT textbook's own diagram.
Own-drawn recreation of NCERT Fig 8.2 ( …
Growth over the decades
- In the 1980s China grew at nearly double-digit rates while many developed countries found it difficult to maintain even a 5 per cent growth rate. Also notice from Table 8.2 that in the 1980s Pakistan was ahead of India, while India was at the bottom of the three.
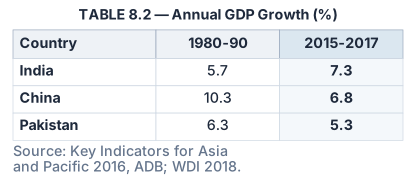
| Country | 1980-90 | 2015-2017 |
|---|---|---|
| India | 5.7 | 7.3 |
| China | 10.3 | 6.8 |
| Pakistan | 6.3 | 5.3 |
- In 2015–17 there was a decline in both Pakistan's and China's growth rates, while India recorded a moderate increase. Some scholars hold the reform process introduced in Pakistan, together with prolonged political instability, responsible for its declining growth rate.
Employment versus output by sector
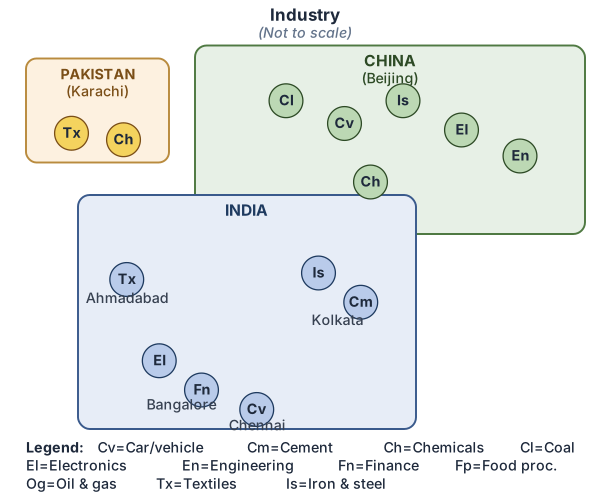
Now look at how people engaged in different sectors contribute to Gross Domestic Product, more accurately called Gross Value Added (GVA) today.
Drawn by us to help you understand the concept clearly, and verified to make sure it's accurate. For exams, practice from your NCERT textbook's own diagram.
Own-drawn recreation of NCERT Fig 8.3 ( …
- Agriculture: In China, because of its terrain and climate, only about 10 per cent of its total land area is cultivable — its total cultivable area is only about 40 per cent of India's. Until the 1980s more than 80 per cent of Chinese people depended on farming as their sole livelihood; since then the government has encouraged people to move into handicrafts, commerce and transport. In 2018–19, with 26 per cent of its workforce engaged in agriculture, China's agriculture contributed only 7 per cent of GVA. In both India and Pakistan the contribution of agriculture to GVA was 16 and 24 per cent respectively, but a much larger share of the workforce depends on it — about 43 per cent in India and 41 per cent in Pakistan.
- Industry: In India, industry's workforce share is 25 per cent, but it produces goods worth 30 per cent of GVA. In China, industry contributes 41 per cent to GVA while employing 28 per cent of the workforce. In Pakistan, 24 per cent of the workforce is in industry, producing 19 per cent of GVA.
- Services: In all three countries the service sector contributes the highest share of GVA — 54, 52 and 57 per cent for India, China and Pakistan respectively.
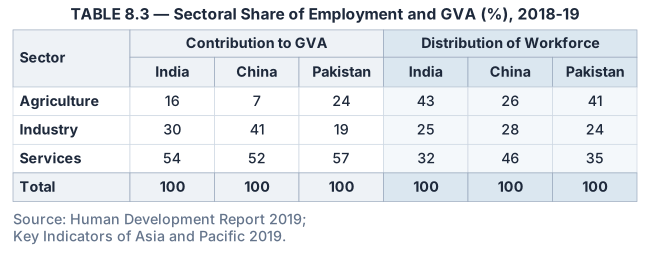
| Sector | GVA India | GVA China | GVA Pakistan | Workforce India | Workforce China | Workforce Pakistan |
|---|---|---|---|---|---|---|
| Agriculture | 16 | 7 | 24 | 43 | 26 | 41 |
| Industry | 30 | 41 | 19 | 25 | 28 | 24 |
| Services | 54 | 52 | 57 | 32 | 46 | 35 |
| Total | 100 | 100 | 100 | 100 | 100 | 100 |
The pattern of structural change
In the normal course of development, countries first shift their employment and output from agriculture to industry and then to services — this is what has happened in China, as Table 8.3 shows. India and Pakistan, by contrast, have shifted their workforce directly into services: the proportion of the workforce in industry stays low, at 25 per cent in India and 24 per cent in Pakistan.
Looking at the service-sector workforce specifically, in the 1980s India, China and Pakistan employed about 17, 12 and 27 per cent of their workforce there; by 2019 this had reached the level of 32, 46 and 35 per cent respectively. …
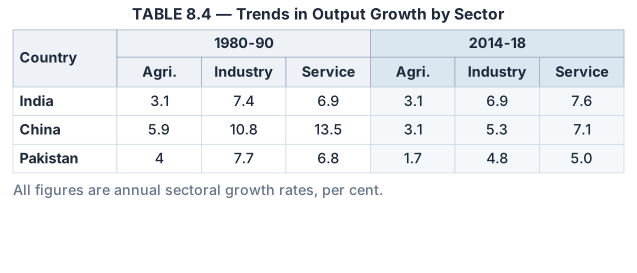
| Country | Agri. 1980-90 | Industry 1980-90 | Service 1980-90 | Agri. 2014-18 | Industry 2014-18 | Service 2014-18 |
|---|---|---|---|---|---|---|
| India | 3.1 | 7.4 | 6.9 | 3.1 | 6.9 | 7.6 |
| China | 5.9 | 10.8 | 13.5 | 3.1 | 5.3 | 7.1 |