Economics · Ch 9 — Production and Costs
The Law of Diminishing Marginal Product and the Law of Variable Proportions
The Law of Diminishing Marginal Product and the Law of Variable Proportions
The Law of Diminishing Marginal Product and the Law of Variable Proportions
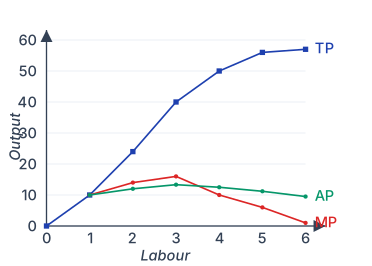
When we plot the data from Table 3.2 — with labour on the X‑axis and output on the Y‑axis — we get curves that reveal a clear pattern. Total Product (TP) rises as more labour is employed, but the rate of increase is not constant. For instance, moving from 1 to 2 units of labour raises TP by 10 units; moving from 2 to 3 raises it by 12 units. This changing rate is captured by the Marginal Product (MP).
Drawn by us to help you understand the concept clearly, and verified to make sure it's accurate. For exams, practice from your NCERT textbook's own diagram.
Plotting the Table 3.2 data makes the pattern visible. The Total Product (TP) curve climbs steeply at first and then flattens as extra labour adds less and less to output. The Marginal Product (MP) curve rises to a peak of 16 (at 3 units of labour) and then diminishes, capturing the law of variable proportions. The Average Product (AP) curve rises, reaches its maximum where MP crosses it, and then falls more gently than MP — MP …
Using the table: when L goes from 1 to 2, TP changes from 10 to 24. So . Since inputs cannot be negative, marginal product is undefined at zero units of labour. A key relationship: total product is the sum of the marginal products of all preceding units — each unit’s MP adds up to the TP at that level.
Here is the data from Table 3.2:
| Labour (L) | TP | MP | AP |
|---|---|---|---|
| 0 | 0 | – | – |
| 1 | 10 | 10 | 10 |
| 2 | 24 | 14 | 12 |
| 3 | 40 | 16 | 13.33 |
| 4 | 50 | 10 | 12.5 |
| 5 | 56 | 6 | 11.2 |
| 6 | 57 | 1 | 9.5 |
Notice that MP first rises (up to 3 units of labour) and then begins to fall. This tendency — MP initially increasing, then decreasing — is called the law of variable proportions or the law of diminishing marginal product.
The law of variable proportions states: as we increase the employment of one factor (holding the other fixed), the marginal product of that factor first rises, reaches a peak, and then eventually falls.
Why does this happen?
To understand, we need the concept of factor proportions — the ratio in which the two inputs (say, labour and land) are combined. When we hold one factor fixed and increase the other, the factor proportions change. Initially, as we add more of the variable input, the proportions become more suitable for production, and each additional unit adds more to output — MP rises.
But beyond a certain point, the production process becomes “crowded” with the variable input. Consider a farmer with 4 hectares of land. With just 1 worker, there is too much land for one person to cultivate efficiently. As more workers are hired, the amount of labour per unit of land increases, and each worker adds proportionally more to total output — MP rises. When the fourth worker is hired, the land starts to feel crowded. Each worker now has insufficient land to work efficiently, so the output added by each additional worker becomes proportionally less — MP begins to fall.
A common mistake is to think the law says MP always falls from the start. It does not — it first rises, then falls. The “diminishing” part refers to the eventual decline after a peak.
General shapes of the TP, MP, and AP curves
From these observations, we can describe the typical shapes:
- TP curve: rises throughout, but at an increasing rate initially (convex from below), then at a decreasing rate (concave from below), eventually flattening. …