Chemistry · Ch 3 — Chemical Kinetics
Temperature Dependence of the Rate of a Reaction
Temperature Dependence of the Rate of a Reaction
Rate Increases with Temperature
Almost every chemical reaction speeds up when the temperature is raised. The decomposition of shows this sharply: the same fraction of material decomposes in about 12 minutes at , in 5 hours at , and takes as long as 10 days at . A more everyday example is the reaction between potassium permanganate and oxalic acid — the purple colour of fades noticeably faster when the mixture is warmed.
As a rough working rule:
For a chemical reaction, a rise in temperature very nearly doubles the rate constant.
This is only an approximate guide — the real, quantitative link between rate constant and temperature is given by the Arrhenius equation.
The Arrhenius Equation
- — the rate constant
- — the Arrhenius (or frequency/pre-exponential) factor, a constant characteristic of the given reaction
- — the activation energy, expressed in energy per mole (J mol)
- — the gas constant
- — the absolute temperature
The Dutch chemist J.H. van't Hoff first put forward an equation of this form; it was the Swedish chemist Arrhenius who supplied its physical meaning and interpretation, so it now carries his name.
Activation Energy and the Reaction Pathway
The idea behind is best seen through a simple gas-phase reaction:
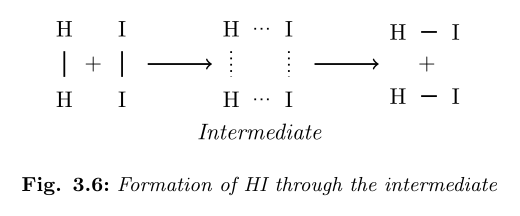
Arrhenius pictured this happening only when a hydrogen molecule and an iodine molecule collide and momentarily join into an unstable, short-lived species — the activated complex (see fig-3-6, which sketches how this intermediate forms and then splits into two HI molecules).
Drawn by us to help you understand the concept clearly, and verified to make sure it's accurate. For exams, practice from your NCERT textbook's own diagram.
What the Figure Shows
The figure is a reaction mechanism diagram — not a plot with axes, but a stepwise scheme of molecular collisions. It depicts the reaction:
The diagram shows three stages from left to right:
- Reactants: A hydrogen molecule () and an iodine molecule () approach each other.
- Activated complex (intermediate): The two molecules collide and form a square-shaped cluster with dotted (partial) bonds connecting the two H atoms and the two I atoms. This unstable arrangement is the activated complex — it exists only for an extremely short time.
- Products: The activated complex breaks apart, yielding two separate HI molecules.
The dotted bonds in the intermediate indicate that the original and bonds are partially broken, while new bonds are partially formed. This is the transition state of the reaction.
The Physical Idea
The figure illustrates the collision theory concept that for a reaction to occur, reactant molecules must collide with sufficient energy and proper orientation to form an unstable intermediate (the activated complex). The energy required to reach this intermediate from the reactants is called the activation energy ().
The key insight: not every collision leads to reaction — only those collisions that overcome the activation energy barrier can form the activated complex and proceed to products.
Key Formula Developed with This Figure
The textbook uses this figure to introduce the Arrhenius equation, which quantifies how the rate constant depends on temperature and activation energy:
Where:
- = rate constant (units depend on reaction order)
- = Arrhenius factor (or frequency factor) — a constant specific to the reaction, representing the frequency of collisions with proper orientation
- = activation energy (in )
- = gas constant ()
- = absolute temperature (in Kelvin) …
The energy that must be supplied to bring the reactants up to this activated-complex state is the activation energy.
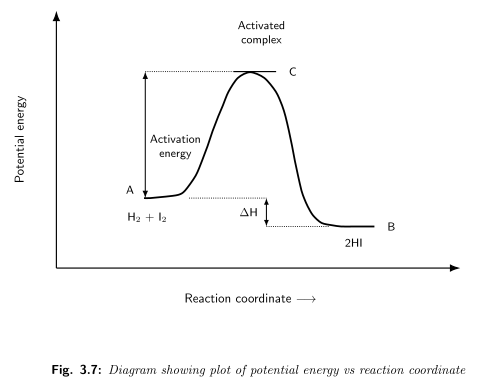
Plotting potential energy against the reaction coordinate (a measure of how far the reaction has progressed from reactants to products) turns this into a picture of an energy barrier: reactants sit at one level, the activated complex sits at a peak above them, and products settle at a final level once the complex breaks apart (fig-3-7 shows this profile).
Drawn by us to help you understand the concept clearly, and verified to make sure it's accurate. For exams, practice from your NCERT textbook's own diagram.
What the Diagram Shows
The figure plots potential energy (on the y‑axis) against reaction coordinate (on the x‑axis). The reaction coordinate is a conceptual axis that tracks the progress of the reaction from reactants to products — it is not a physical distance but a measure of how far the reaction has proceeded along the minimum‑energy path.
The curve begins at a left‑hand plateau labelled H₂ + I₂ (the reactants). It rises smoothly to a single peak labelled Activated complex (the transition state), then descends to a right‑hand plateau labelled 2HI (the products). The product plateau is drawn lower than the reactant plateau, indicating that the reaction is exothermic — the products have less potential energy than the reactants.
Two vertical double‑headed arrows are marked:
- One from the reactant level to the peak, labelled Activation energy ().
- Another between the reactant level and the product level, labelled ΔH (the enthalpy change of the reaction).
The Physical Idea
The diagram illustrates the energy barrier that must be overcome for a reaction to occur, even for an exothermic reaction like this one. The reactants must first acquire enough energy to reach the activated complex — an unstable, high‑energy intermediate — before the reaction can proceed. Only molecules that possess kinetic energy at least equal to can surmount this barrier. Once the activated complex forms, it decomposes into products, releasing energy — net energy is released overall since the products sit lower than the reactants (ΔH is negative).
This picture directly leads to the Arrhenius equation, which quantifies how the rate constant depends on temperature and activation energy:
where:
- = rate constant (units depend on reaction order)
- = Arrhenius factor (or pre‑exponential factor) — a constant specific to the reaction, related to the frequency of collisions with the correct orientation
- = activation energy (in J mol⁻¹)
- = universal gas constant ()
- = absolute temperature (in K)
The exponential term represents the fraction of molecules that have kinetic energy greater than at temperature . This fraction is tiny when is large or is low, and increases sharply when is raised or is lowered (e.g., by a catalyst).
Key Formula Derived from the Figure
The textbook uses the Arrhenius equation in its logarithmic form to relate rate constants at two different temperatures:
…
The height of that peak above the reactants is the activation energy. Because some energy is also released as the complex collapses into products, the overall enthalpy change of the reaction depends on the nature of the reactants and products themselves, not merely on the height of the barrier.
Molecular Energy Distribution
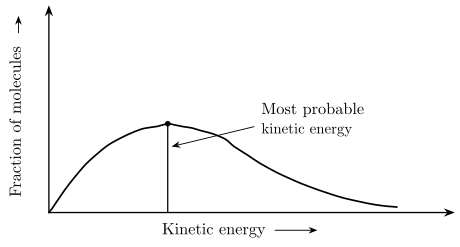
Not every molecule in a reacting sample carries the same kinetic energy — predicting the behaviour of one particular molecule is not practical, so Maxwell and Boltzmann used statistics to describe the whole population instead. Their treatment plots the fraction of molecules possessing a given kinetic energy, (where is the number of molecules with energy and is the total number of molecules), against that kinetic energy — the resulting curve peaks at the most probable kinetic energy, with fewer molecules found at energies above or below this value (fig-3-8 illustrates this distribution).
Drawn by us to help you understand the concept clearly, and verified to make sure it's accurate. For exams, practice from your NCERT textbook's own diagram.
What the Figure Shows
The plot is a Maxwell–Boltzmann distribution curve for gaseous molecules.
- The x-axis is kinetic energy ().
- The y-axis is the fraction of molecules , where is the number of molecules with energy and is the total number of molecules.
The curve rises from zero, reaches a single peak, then falls asymptotically toward zero.
- The peak corresponds to the most probable kinetic energy — the energy possessed by the largest fraction of molecules.
- The area under the entire curve equals 1 (total probability).
The Physical Idea
Not all molecules in a reacting gas have the same kinetic energy. Most have energies near the most probable value, but a small fraction have much higher or lower energies.
For a reaction to occur, molecules must collide with energy at least equal to the activation energy . Only those molecules in the high-energy tail of the distribution (to the right of ) can overcome the energy barrier.
When temperature increases:
- The peak shifts to higher energy.
- The curve broadens (spreads to the right).
- The fraction of molecules with energy increases sharply — often doubling for a 10 K rise.
Key Formula Developed from This Figure
The fraction of molecules with kinetic energy is given by the exponential factor in the Arrhenius equation:
- = rate constant
- = pre-exponential factor (frequency factor)
- = activation energy (J mol⁻¹)
- = gas constant (8.314 J mol⁻¹ K⁻¹)
- = absolute temperature (K) …
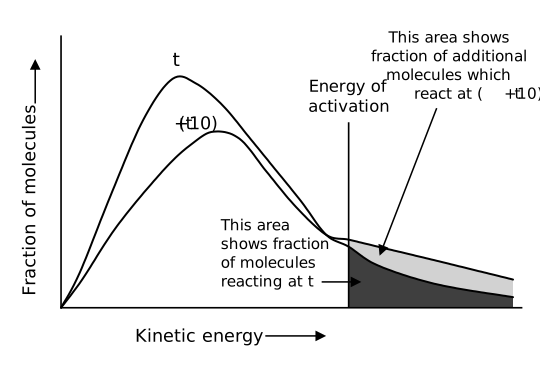
Raising the temperature shifts this picture in a very specific way (fig-3-9 compares the curve at and at ): the peak of the curve moves toward higher energy and the curve flattens out, spreading further to the right — so a larger share of molecules now carry much higher energies.
Drawn by us to help you understand the concept clearly, and verified to make sure it's accurate. For exams, practice from your NCERT textbook's own diagram.
What the Figure Shows
The figure plots fraction of molecules (on the y‑axis) against kinetic energy (on the x‑axis). Two Maxwell–Boltzmann distribution curves are drawn on the same set of axes:
- The curve at temperature is taller and narrower — its peak is higher and lies at a lower kinetic energy.
- The curve at temperature is broader, lower, and shifted to the right — its peak is lower and occurs at a higher kinetic energy.
A vertical line is drawn at the value of the activation energy on the x‑axis. The area under each curve to the right of this line (the shaded tail) represents the fraction of molecules with kinetic energy at that temperature. The shaded area under the curve is smaller; the shaded area under the curve is larger — roughly double — showing that a higher temperature dramatically increases the fraction of molecules that can overcome the energy barrier.
Physical Idea
Not all molecules in a reacting sample have the same kinetic energy. Only those with energy at least can collide effectively and lead to product formation. Raising the temperature does two things:
- It shifts the entire distribution to higher energies (the most probable energy increases).
- It broadens the curve, so a greater proportion of molecules lie in the high‑energy tail.
Because the total area under each curve must be the same (the total probability is always 1), the curve at higher temperature is necessarily lower and wider. The key takeaway: even a small temperature rise (e.g., 10 K) can double the fraction of molecules with energy , which explains why reaction rates increase sharply with temperature.
Key Formula Developed from This Figure
The fraction of molecules having kinetic energy greater than or equal to is given by the exponential factor in the Arrhenius equation:
- = rate constant
- = Arrhenius factor (also called pre‑exponential factor or frequency factor) — a constant for a given reaction
- = activation energy (in J mol⁻¹)
- = gas constant (8.314 J mol⁻¹ K⁻¹)
- = absolute temperature (in K) …
The total area under the curve cannot change, since the total probability of finding a molecule somewhere on the curve must always add up to one. What does change is the area lying beyond the activation-energy mark: raising the temperature by just roughly doubles the fraction of molecules whose energy equals or exceeds , and it is this doubled fraction of "energetic enough" molecules that shows up as a doubled reaction rate.
This is exactly what the exponential term in the Arrhenius equation represents — is the fraction of molecules that possess kinetic energy greater than at temperature .
Logarithmic Form and the Arrhenius Plot
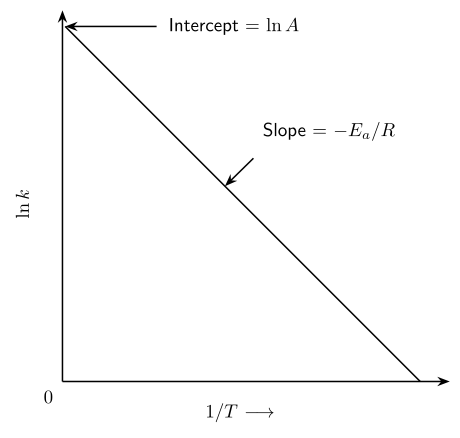
Taking the natural logarithm of the Arrhenius equation turns it into a straight-line relationship:
Plotting against therefore gives a straight line (fig-3-10), with
so that both the activation energy and the frequency factor of a reaction can be read off directly from experimental -versus- data.
Drawn by us to help you understand the concept clearly, and verified to make sure it's accurate. For exams, practice from your NCERT textbook's own diagram.
What the Figure Shows
The figure is a straight-line graph with two axes:
- Y‑axis: (natural logarithm of the rate constant)
- X‑axis: (reciprocal of absolute temperature, in )
The line slopes downward from left to right. Two key features are labelled:
- Intercept on the y‑axis =
- Slope of the line =
There is only one line — no curves, no multiple panels, no data points. It is a clean, idealised Arrhenius plot.
The Physical Idea
The Arrhenius equation tells us how the rate constant depends on temperature:
Taking natural logs gives the linear form:
This is exactly the equation of a straight line , where:
- (slope)
- (intercept)
So plotting against should give a straight line — and that is what Fig. 3.10 shows. The downward slope means that as increases (i.e., as temperature decreases), decreases — which matches the fact that rate constants are smaller at lower temperatures.
Key Formulas Developed from This Figure
From the straight line, we can extract two important quantities:
- Activation energy :
- Pre‑exponential factor :
The textbook also derives a two‑temperature formula using the same idea. For rate constants at and at :
or in base‑10 log form:
Here:
- = activation energy (J/mol)
- = gas constant ()
- = absolute temperature (K)
- = Arrhenius factor (same units as )
Why This Matters for Exams …
…