Chemistry · Ch 1 — Solutions
Vapour Pressure of Solutions of Solids in Liquids
Vapour Pressure of Solutions of Solids in Liquids
A large and important class of solutions is made of solids dissolved in liquids — sodium chloride, glucose, urea and cane sugar dissolved in water, or iodine and sulphur dissolved in carbon disulphide. When the dissolved solid is non-volatile, some physical properties of the solution differ noticeably from those of the pure solvent, and vapour pressure is the clearest example.
Why a non-volatile solute lowers the vapour pressure
A liquid at a given temperature evaporates, and at equilibrium the pressure exerted by its vapour over the liquid is its vapour pressure.
Drawn by us to help you understand the concept clearly, and verified to make sure it's accurate. For exams, practice from your NCERT textbook's own diagram.
What the Figure Shows
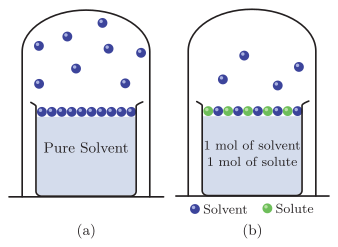
The figure presents two side-by-side closed bell-jar systems, labeled (a) and (b), to illustrate how adding a non-volatile solute reduces the vapour pressure of a solvent.
- Panel (a) shows a beaker of pure solvent. The liquid surface is entirely covered by solvent molecules (represented as small spheres). Above the liquid, many solvent spheres are present in the vapour phase, indicating a high rate of evaporation and a high equilibrium vapour pressure.
- Panel (b) shows a beaker containing a solution made of 1 mol of solvent and 1 mol of solute. The liquid surface now has both solvent spheres and solute spheres (distinguished by a legend). The solute particles occupy part of the surface area, blocking some solvent molecules from escaping into the vapour. Consequently, the vapour phase above the solution contains visibly fewer solvent spheres than in panel (a).
The Physical Idea
The figure teaches that vapour pressure depends on the number of solvent molecules at the liquid surface. In a pure solvent, every part of the surface can release solvent molecules into the vapour. When a non-volatile solute is dissolved, the solute particles take up space at the surface, reducing the fraction of surface area available for solvent evaporation. This lowers the rate of evaporation and, at equilibrium, the vapour pressure of the solvent above the solution is less than that above the pure solvent.
Key Formula Developed from This Figure
The textbook uses this concept to derive Raoult’s law for a solution of a non-volatile solute in a volatile solvent. If:
- = vapour pressure of the solvent over the solution
- = mole fraction of the solvent in the solution
- = vapour pressure of the pure solvent
Then Raoult’s law states:
The decrease in vapour pressure (relative to the pure solvent) is: …
- In a pure liquid, the entire surface is occupied by solvent molecules, so every molecule at the surface is a potential escapee into the vapour.
- In a solution of a non-volatile solute, the surface now carries both solute and solvent molecules. The solute particles take up part of the surface area, so the fraction of surface occupied by solvent molecules is reduced.
Fewer solvent molecules at the surface means fewer of them can escape into the vapour. Since the non-volatile solute contributes nothing to the vapour, the vapour above the solution comes from the solvent alone — and its pressure is therefore lower than that of the pure solvent at the same temperature.
The size of this lowering depends only on how much non-volatile solute is present, not on its chemical nature. For instance, dissolving 1.0 mol of sucrose in a kilogram of water lowers the vapour pressure by nearly the same amount as dissolving 1.0 mol of urea in the same water at the same temperature.
Raoult's law for a non-volatile solute
Raoult's law can be stated in a general form: for any solution, the partial vapour pressure of each volatile component is directly proportional to its mole fraction.
In a binary solution, denote the solvent by 1 and the non-volatile solute by 2. Only solvent molecules reach the vapour phase, so only the solvent contributes to the vapour pressure. Let be the vapour pressure of the solvent, its mole fraction, and its vapour pressure in the pure state. Then:
The proportionality constant is just the vapour pressure of the pure solvent, .
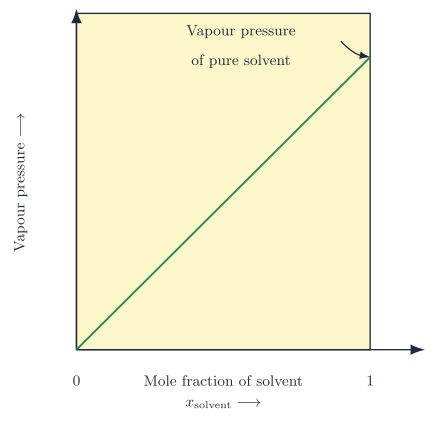
The linear variation …
Drawn by us to help you understand the concept clearly, and verified to make sure it's accurate. For exams, practice from your NCERT textbook's own diagram.
What the Graph Shows
The figure plots vapour pressure (on the vertical -axis) against mole fraction of the solvent (on the horizontal -axis, ranging from to ). A single straight line starts at the origin and ends at the point where . At this endpoint, the height of the line is labelled "vapour pressure of pure solvent".
Physical Meaning
The straight line represents the behaviour of a solution that obeys Raoult's law at every concentration. As the mole fraction of the solvent increases from to , the vapour pressure rises linearly from zero (when there is no solvent) to the vapour pressure of the pure solvent (when no solute is present). This linear relationship is the hallmark of an ideal solution — one in which the intermolecular forces between all molecules (solvent–solvent, solute–solute, and solvent–solute) are essentially equal.
Key Formula Developed from This Figure
Raoult's law for the solvent (component 1) is expressed as:
where:
- = vapour pressure of the solvent in the solution
- = mole fraction of the solvent in the solution
- = vapour pressure of the pure solvent (the constant of proportionality)
The graph directly illustrates this equation: the slope of the straight line is , and for any , the corresponding is read off the line. Because the line passes through the origin, when (no solvent), ; when (pure solvent), .