Chemistry · Ch 4 — The d- and f-Block Elements
Variation in Atomic and Ionic Sizes of Transition Metals
Variation in Atomic and Ionic Sizes of Transition Metals
The General Trend Within a Series
For ions of a given charge within one transition series, radius decreases steadily as atomic number increases. The reason is the same poor-shielding argument that recurs throughout this chapter: each time the nuclear charge goes up by one unit, the new electron being added enters a orbital, and electrons are not very effective at shielding one another from the nucleus. Because the shielding added is smaller than the increase in nuclear charge, the net electrostatic pull that the nucleus exerts on the outermost electron keeps increasing, and so ionic radius contracts. Atomic radii within a series follow the same downward trend, though here the change is comparatively small.
Comparing the 3, 4 and 5 Series — Lanthanoid Contraction
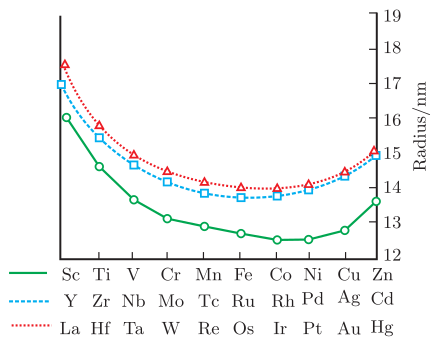
A more striking comparison emerges when the sizes of corresponding elements are set side by side across the three series (fig-4-3). Going from the first (3) series to the second (4) series, radius clearly increases, exactly as would be expected on descending a group. But the third (5) series does not continue that increase — its radii come out almost identical to those of the second (4) series.
The explanation is that the 4 orbitals must be filled (across the lanthanoids) before the 5 series can begin. Filling the 4 subshell produces its own steady contraction in atomic radius, called the lanthanoid contraction, and this contraction is large enough to essentially cancel out the increase in size that would otherwise have been expected on going from the 4 to the 5 row. The net outcome is that the second and third -series elements of a given group end up with very similar radii — for example, against — and, as a consequence, much more similar physical and chemical properties than a simple family relationship would predict.
Drawn by us to help you understand the concept clearly, and verified to make sure it's accurate. For exams, practice from your NCERT textbook's own diagram.
What the Graph Shows
The figure plots metallic radius (in pm) on the y‑axis against the elements of the three transition series on the x‑axis. Three separate curves are drawn:
- First series (3d): Sc → Zn
- Second series (4d): Y → Cd
- Third series (5d): La, then Hf → Hg
Each curve shows how the atomic size changes as you move from left to right across a transition series.
What Each Axis and Curve Represents
- Y‑axis: Metallic radius (in pm) – the half‑distance between nuclei in a metallic crystal.
- X‑axis: Elements arranged by increasing atomic number within each series.
- Curves:
- All three curves first decrease (radius shrinks as nuclear charge increases).
- In the middle of each series, the radius stays nearly constant.
- Near the end, the radius rises slightly (due to electron‑electron repulsion in filled or nearly‑filled d‑orbitals).
- Key visual feature: The 4d and 5d curves almost coincide – they lie close together and well above the 3d curve. This overlap is the graphical signature of the lanthanoid contraction.
The Physical Idea
The graph teaches two central concepts:
-
General trend across a transition series: As you add protons, the nuclear charge increases. Electrons are added to inner (n–1)d orbitals, which shield the outer electrons poorly. So the effective nuclear charge felt by the outermost electrons rises, pulling them inward – hence the initial decrease in radius.
-
Lanthanoid contraction: In the 5d series, the 4f orbitals (filled before the 5d orbitals) provide even poorer shielding than d‑orbitals. As a result, the 5d elements experience a stronger pull from the nucleus, making their radii almost identical to those of the 4d elements. This is why the 4d and 5d curves nearly overlap – a phenomenon called the lanthanoid contraction.
Key Formula the Textbook Develops
The textbook uses this figure to explain why the second and third transition series have nearly identical radii – a direct consequence of the lanthanoid contraction. The underlying reason is the poor shielding of one electron by another in the same set of orbitals, especially for f‑electrons.
The effective nuclear charge () is the key concept:
- = atomic number (number of protons)
- = shielding constant (accounts for electron‑electron repulsion) …
…
| Sc | Ti | V | Cr | Mn | Fe | Co | Ni | Cu | Zn | |
|---|---|---|---|---|---|---|---|---|---|---|
| Atomic number | 21 | 22 | 23 | 24 | 25 | 26 | 27 | 28 | 29 | 30 |
| Config. M | ||||||||||
| Config. | ||||||||||
| Config. | ||||||||||
| Config. | [Ar] | — | — | |||||||
| /kJ mol⁻¹ | 326 | 473 | 515 | 397 | 281 | 416 | 425 | 430 | 339 | 126 |
| I | 631 | 656 | 650 | 653 | 717 | 762 | 758 | 736 | 745 | 906 |
| II | 1235 | 1309 | 1414 | 1592 | 1509 | 1561 | 1644 | 1752 | 1958 | 1734 |
| III | 2393 | 2657 | 2833 | 2990 | 3260 | 2962 | 3243 | 3402 | 3556 | 3837 |
| Radius M/pm | 164 | 147 | 135 | 129 | 137 | 126 | 125 | 125 | 128 | 137 |
| Radius /pm | — | — | 79 | 82 | 82 | 77 | 74 | 70 | 73 | 75 |
| Radius /pm | 73 | 67 | 64 | 62 | 65 | 65 | 61 | 60 | — | — |