Q.Draw a standard ECG and explain the different segments in it.
🔒You're viewing a preview — the full solution, concept, methods & PYQ mapping are locked.
🔒 Start your 14-day free trial to unlock the full solution →Concept understanding — ECG Waves
ECG Waves: The Electrical Signature of Your Heartbeat
Imagine your heart as a small, muscular pump that runs on electricity. Before any chamber of the heart actually contracts, a wave of electrical excitation sweeps through its muscle cells, telling them to squeeze. An ECG (electrocardiogram) is simply a recording of that electrical activity from the surface of your body. It does not measure the squeezing itself — it measures the electrical signal that causes the squeezing.
The tracing you see on an ECG paper is a voltage-versus-time graph. The heart's electrical signal is tiny, but with electrodes placed on your skin, we can detect it. The pattern that emerges is not random. It has distinct bumps and dips, each corresponding to a specific electrical event in a specific part of the heart.
The Three Main Waves: P, QRS, and T
The normal heartbeat produces three major deflections on the ECG. Each one tells you which chamber is being activated.
The P wave is the first small, upward bump. It represents the electrical activation (depolarization) of the atria — the two upper chambers. When the sinoatrial node (the heart's natural pacemaker) fires, the signal spreads across the right and left atria, causing them to contract and push blood into the ventricles. The P wave is the signature of that atrial electrical event.
The QRS complex is the next big, sharp, spiky deflection — it looks like a rapid zigzag. This represents the electrical activation of the ventricles — the two large lower chambers. Because the ventricles have a lot more muscle mass than the atria, their electrical signal is much larger, producing a tall, narrow complex. The Q wave is the first small downward dip, the R wave is the tall upward spike, and the S wave is the downward dip that follows. Together they form the QRS complex. This is the signal that triggers the main pumping action of the heart.
The T wave is the broader, rounded bump that comes after a short pause following the QRS complex. It represents the recovery (repolarization) of the ventricles — the electrical reset that happens after they have contracted. The ventricles need to return to their resting electrical state before they can be activated again. The T wave is that reset signal.
Atrial repolarization does happen, but it is a tiny signal that gets completely buried by the much larger QRS complex. That is why you do not see a separate "atrial T wave" on a normal ECG.
The Big Picture: Timing and Sequence
The sequence is always the same: P wave → QRS complex → T wave. This order reflects the normal flow of electricity through the heart.
- The SA node fires in the right atrium. The P wave begins.
- The electrical signal travels through the atria to the AV node, where it is deliberately delayed (giving the atria time to finish contracting and fill the ventricles).
- The signal then races down the bundle of His and Purkinje fibers into the ventricles. The QRS complex appears.
- The ventricles contract powerfully, pumping blood to the lungs and the rest of the body.
- The ventricles recover electrically. The T wave appears. …
A standard electrocardiogram (ECG) is a graphical record of the heart's electrical activity across one cardiac cycle, showing a series of peaks labelled from P to T.
- P-wave — represents the electrical excitation, or depolarisation, of the atria, which leads to the contraction of both atria.
- QRS complex — represents the depolarisation of the ventricles, which sets off ventricular contraction; systole begins shortly after the Q point.
- T-wave — represents the repolarisation of the ventricles, their return from the excited state to normal; the end of the T-wave marks the end of systole. …
A standard ECG is a graph of the heart's electrical activity in one cardiac cycle, with a P-wave, a QRS complex and a T-wave that stand for atrial excitation, ventricular excitation and ventricular recovery.
An electrocardiogram, or ECG, is a graphical record of the electrical activity of the heart across a single cardiac cycle, produced by a machine called the electrocardiograph. To obtain a standard ECG the patient is connected to the machine through three electrical leads — one attached to each wrist and one to the left ankle — which continuously pick up the heart's electrical activity. If a more detailed evaluation is needed, several additional leads are placed over the chest, but the standard record uses these three.
On the trace, each peak is labelled with a letter from P to T, and every letter corresponds to a specific electrical event in the heart:
- The P-wave represents the electrical excitation, or depolarisation, of the atria. This excitation is what leads to the contraction of both atria.
- The QRS complex represents the depolarisation of the ventricles, which sets off ventricular contraction. Contraction begins shortly after the Q point, marking the start of systole.
- The T-wave represents the repolarisation of the ventricles — their return from the excited state back to normal. The end of the T-wave marks the end of systole. …
Method: Explaining a Labelled Diagram or Trace (the ECG)
Use this approach for any question asking you to draw and explain a labelled physiological trace or diagram.
Steps
Step 1: State what the diagram records overall, before describing any individual part
An ECG is a record of the heart's electrical activity across one cardiac cycle — establish this first so every labelled feature is understood in that context.
Step 2: Go through the labelled features in the order they appear, left to right
For an ECG that is P-wave → QRS complex → T-wave. Never jump between features out of sequence.
Step 3: For each feature, state which chamber's electrical event it represents and whether it is depolarisation or repolarisation …
- AP EAPCET 2025Set ap-2025-05-19-AN1 markMCQQ.Match the following : ECG Abnormality - Clinical condition A) Englarged P wave I) Bradycardia B) Prolonged P-R interval II) Myocardial infarction C) Shortened Q-T interval III) Atrial enlargement D) Elevated S-T segment IV) Hypercalcemia V) Hypocalcemia Identify the correct match (A) A-I, B-III, C-V, D-II (B) A-III, B-I, C-IV, D-II (C) A-IV, B-II, C-I, D-III (D) A-III, B-II, C-V, D-IV
›Reveal solutionSolution
This tests recall of ECG abnormality-to-clinical-condition associations. The answer is (B) A-III, B-I, C-IV, D-II.
Concept and Intuition
Each segment of the ECG corresponds to a specific electrical event in the heart, and characteristic distortions map to specific conditions:
- The P wave represents atrial depolarization; an abnormally tall/enlarged P wave suggests atrial hypertrophy/enlargement.
- The P-R interval reflects the time for the impulse to travel from atria through the AV node to the ventricles; prolongation reflects delayed conduction, often seen with a slow heart rate (bradycardia) or AV nodal block.
- The Q-T interval reflects total ventricular depolarization+repolarization time; hypercalcemia shortens it (due to faster repolarization), while hypocalcemia prolongs it.
- Elevation of the S-T segment is the classic ECG marker of acute myocardial infarction (injury current from ischemic myocardium).
Step-by-Step Solution …
- AP EAPCET 2025Set ap-2025-05-19-FN1 markMCQQ.Tall T-wave of ECG indicates (A) Hyperkalemia (B) Hypokalemia (C) Bradycardia (D) Tachycardia
›Reveal solutionSolution
Tall, peaked T-waves on ECG are the hallmark of hyperkalemia. Answer: (A).
Concept and Intuition
The ECG's T-wave represents ventricular repolarization, and its shape is sensitive to blood electrolyte levels, particularly potassium:
- Hyperkalemia (excess blood K⁺) speeds up/alters the repolarization process, producing tall, narrow, peaked ('tented') T-waves — a classic and clinically important ECG warning sign, since severe hyperkalemia can be life-threatening.
- Hypokalemia (low blood K⁺) has roughly the opposite effect — flattened T-waves, and can produce a prominent U-wave.
- Bradycardia (abnormally slow heart rate) and Tachycardia (abnormally fast heart rate) refer to the heart RATE (frequency of beats), not specifically to T-wave shape/amplitude — they are a different category of ECG abnormality.
Step-by-Step Solution
- Recall what a 'tall T-wave' specifically indicates in ECG interpretation: altered repolarization due to a specific electrolyte imbalance. …
- AP EAPCET 2024Set ap-2024-05-17-AN1 markMCQQ.In an ECG prolonged Q – T interval indicates (A) Bradycardia (B) Myocardial infarction (C) Tachycardia (D) Hyperkalemia
›Reveal solutionSolution
A prolonged Q–T interval signals delayed ventricular repolarization, classically linked to myocardial damage/infarction — the answer is (B).
Concept and Intuition
The Q–T interval spans the start of ventricular depolarization (Q) to the end of ventricular repolarization (T) — it represents the total time the ventricles are electrically "busy." When this interval stretches out, it means the heart muscle's electrical recovery is delayed, which is a hallmark of damaged or ischemic myocardial tissue (and predisposes to dangerous arrhythmias).
Step-by-Step Solution
- Identify what each interval represents: Q-T = total ventricular activity (depolarization + repolarization).
- A prolonged Q-T interval indicates delayed repolarization, most classically linked clinically to myocardial ischemia/infarction.
- Rule out Hyperkalemia: high K+ classically produces tall, peaked T-waves and shortens the QT interval — the opposite effect. …
- AP EAPCET 2024Set ap-2024-05-17-FN1 markMCQQ.Tall T-wave in ECG indicates (A) Hyperkalemia (B) Hypokalemia (C) Hypercalcemia (D) Tachycardia
›Reveal solutionSolution
This tests ECG interpretation basics: a tall T-wave signals hyperkalemia.
Concept and Intuition
The T-wave on an ECG represents ventricular repolarization. Potassium ion concentration strongly affects the resting membrane potential and repolarization kinetics of cardiac cells. When blood potassium rises above normal (hyperkalemia), repolarization becomes faster and more synchronized, which is reflected on the ECG as tall, narrow, peaked ("tented") T-waves. This is a clinically important early sign of dangerous potassium elevation.
Step-by-Step Solution
- Recall what each option represents physiologically: hyperkalemia (excess K+), hypokalemia (deficient K+), hypercalcemia (excess Ca2+), tachycardia (fast heart rate, a rhythm abnormality, not a wave-shape sign).
- Hypokalemia classically causes FLATTENED T-waves and U-waves, not tall ones — opposite of the question. …
- AP EAPCET 2022Set ap-2022-07-11-FN1 markMCQQ.Enlarged P-wave (A) Indicates normal atria (B) Enlarged atria (C) Indicates myocardial infarction (D) Indicates hyper kalemia
›Reveal solutionSolution
On an electrocardiogram (ECG), the P-wave represents the electrical depolarisation of the atria just before they contract. A larger-than-normal P-wave reflects a larger mass of atrial muscle depolarising, i.e., atrial enlargement/hypertrophy.
Concept and Intuition
Each ECG wave corresponds to a specific electrical event of the cardiac cycle: P-wave = atrial depolarisation, QRS complex = ventricular depolarisation, T-wave = ventricular repolarisation. The amplitude/duration of a wave broadly scales with the mass of myocardium generating it, so an enlarged atrium (from conditions like valve disease or hypertension) yields a taller/wider P-wave.
Step-by-Step Solution
- Recognise that the P-wave specifically tracks atrial electrical activity.
- An enlarged (abnormally tall or broad) P-wave means more atrial tissue is depolarising than normal. …
- AP EAPCET 2021Set ap-2021-09-03-FN1 markMCQQ.Recognize the figure and find out the correct matching? [FIGURE] (a typical ECG waveform tracing showing the P, Q, R, S and T waves in sequence; a box labelled 1 sits below a bracket spanning from just before the P wave up to the Q point; a box labelled 2 sits over a bracket spanning the P wave itself; a box labelled 3 sits above a bracket spanning the Q-R-S peak region (the QRS complex); a box labelled 4 sits over a bracket spanning from just after the S point to just before the T wave; and a box labelled 5 sits below a long bracket spanning from the Q point to the end of the T wave) (A) 1 - PR Segment, 2 - PR Interval, 3 - QRS Complex, 4 - ST Segment, 5 - QT Interval (B) 1 - PR Interval, 2 - PR Segment, 3 - QRS Complex, 4 - QT Interval, 5 - ST Segment (C) 1 - PR Segment, 2 - PR Interval, 3 - QRS Complex, 4 - QT Interval, 5 - ST Segment (D) 1 - PR Interval, 2 - PR Segment, 3 - QRS Complex, 4 - ST Segment, 5 - QT Interval
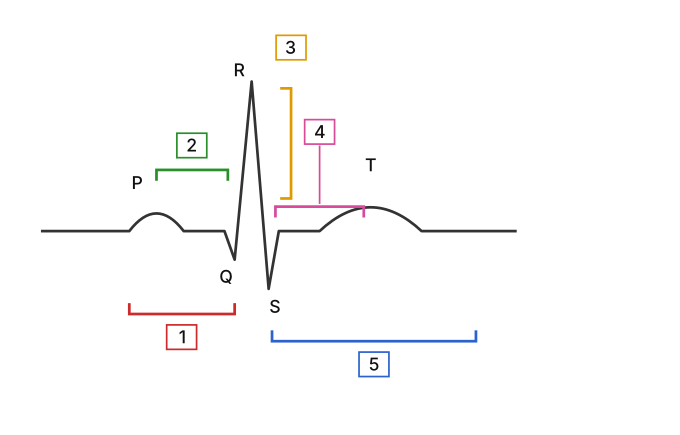
›Reveal solutionSolution
The key is to distinguish between an interval (which includes a wave) and a segment (which is the flat baseline between waves). Box 1 spans from the start of P to Q (PR Interval), Box 2 spans the flat line after P (PR Segment), Box 3 brackets the QRS complex, Box 4 spans the flat line after S (ST Segment), and Box 5 spans from Q to the end of T (QT Interval). The correct matching is option (D).
The question tests your ability to read a standard ECG waveform and correctly label its five main time intervals and segments. The classic pitfall is confusing an interval (which includes a wave) with a segment (which is the flat baseline between waves). Let’s walk through each box.
-
Box 1 – The bracket starts just before the P wave and ends at the Q point (the first downward dip). This span includes the entire P wave and the flat line after it up to Q. Because it includes a wave (the P wave), it is an interval, not a segment. This is the PR Interval (from start of P to start of QRS). So Box 1 = PR Interval.
-
Box 2 – The bracket sits over the flat baseline after the P wave but before the Q wave. It does not include the P wave itself. This is the PR Segment (the flat line from the end of P to the start of Q). So Box 2 = PR Segment.
-
Box 3 – The bracket spans the tall R spike and the surrounding Q and S dips. This is the QRS Complex (ventricular depolarization). So Box 3 = QRS Complex.
-
Box 4 – The bracket spans the flat baseline from the end of the S wave to the start of the T wave. This is the ST Segment (the period when ventricles are depolarized). So Box 4 = ST Segment. …
-
🎓Unlock everything free for 14 days
- ✓Full step-by-step solutions
- ✓Concept-first explanations
- ✓Methods, shortcuts & mistakes
- ✓PYQ mapping + timed mock tests
Full access for 14 days. No credit card required.