Q.Diagrammatic representation of standard ECG is given below.
🔒You're viewing a preview — the full solution, concept, methods & PYQ mapping are locked.
🔒 Start your 14-day free trial to unlock the full solution →Concept understanding — ECG Waves
ECG Waves: The Electrical Signature of Your Heartbeat
Imagine your heart as a small, muscular pump that runs on electricity. Before any chamber of the heart actually contracts, a wave of electrical excitation sweeps through its muscle cells, telling them to squeeze. An ECG (electrocardiogram) is simply a recording of that electrical activity from the surface of your body. It does not measure the squeezing itself — it measures the electrical signal that causes the squeezing.
The tracing you see on an ECG paper is a voltage-versus-time graph. The heart's electrical signal is tiny, but with electrodes placed on your skin, we can detect it. The pattern that emerges is not random. It has distinct bumps and dips, each corresponding to a specific electrical event in a specific part of the heart.
The Three Main Waves: P, QRS, and T
The normal heartbeat produces three major deflections on the ECG. Each one tells you which chamber is being activated.
The P wave is the first small, upward bump. It represents the electrical activation (depolarization) of the atria — the two upper chambers. When the sinoatrial node (the heart's natural pacemaker) fires, the signal spreads across the right and left atria, causing them to contract and push blood into the ventricles. The P wave is the signature of that atrial electrical event.
The QRS complex is the next big, sharp, spiky deflection — it looks like a rapid zigzag. This represents the electrical activation of the ventricles — the two large lower chambers. Because the ventricles have a lot more muscle mass than the atria, their electrical signal is much larger, producing a tall, narrow complex. The Q wave is the first small downward dip, the R wave is the tall upward spike, and the S wave is the downward dip that follows. Together they form the QRS complex. This is the signal that triggers the main pumping action of the heart.
The T wave is the broader, rounded bump that comes after a short pause following the QRS complex. It represents the recovery (repolarization) of the ventricles — the electrical reset that happens after they have contracted. The ventricles need to return to their resting electrical state before they can be activated again. The T wave is that reset signal.
Atrial repolarization does happen, but it is a tiny signal that gets completely buried by the much larger QRS complex. That is why you do not see a separate "atrial T wave" on a normal ECG.
The Big Picture: Timing and Sequence
The sequence is always the same: P wave → QRS complex → T wave. This order reflects the normal flow of electricity through the heart.
- The SA node fires in the right atrium. The P wave begins.
- The electrical signal travels through the atria to the AV node, where it is deliberately delayed (giving the atria time to finish contracting and fill the ventricles).
- The signal then races down the bundle of His and Purkinje fibers into the ventricles. The QRS complex appears.
- The ventricles contract powerfully, pumping blood to the lungs and the rest of the body.
- The ventricles recover electrically. The T wave appears. …
An ECG records the heart's electrical activity; its P wave, QRS complex and T wave correspond to the excitation and recovery of the atria and ventricles, and the recording instrument has a specific name. …
P = atrial depolarisation, QRS = ventricular depolarisation, T = ventricular repolarisation; the machine is the electrocardiograph.
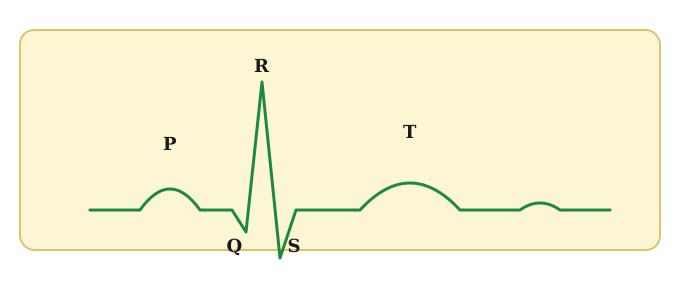
(a) In a standard ECG:
- P wave - represents the depolarisation (electrical excitation) of the atria, leading to atrial contraction.
- QRS complex - represents the depolarisation of the ventricles, leading to ventricular contraction. …
- CBSE 2026Set ANN2 marksQ.Diagrammatic representation of standard ECG is given below.(a) What does P-wave, QRS complex and T-wave indicates ?(b) Name the machine used to obtain this graph.
›Reveal solutionSolution
P = atrial depolarisation, QRS = ventricular depolarisation, T = ventricular repolarisation; the machine is the electrocardiograph.
Diagrammatic presentation standard ecg (a) In a standard ECG:
- P wave - represents the depolarisation (electrical excitation) of the atria, leading to atrial contraction.
- QRS complex - represents the depolarisation of the ventricles, leading to ventricular contraction. …
- CBSE 2023Set ANN2 marksQ.Observe the diagrammatic presentation of ECG. [Figure shown in the original paper](a) What is the expansion of ECG ?(b) What do P and QRS complex indicate ?
›Reveal solutionSolution
ECG stands for electrocardiogram, a graphical record of the heart's electrical activity during a cardiac cycle; the P wave represents atrial depolarisation and the QRS complex represents ventricular depolarisation.
- Expansion: ECG stands for Electrocardiogram.
- What P and QRS complex indicate:
- The P wave represents the depolarisation of the atria (the electrical impulse generated at the SA node spreading through both atria), which causes atrial contraction (atrial systole). …
- CBSE 2022Set ANNUAL2 marksQ.What is electrocardiography and what are the normal components of ECG?
›Reveal solutionSolution
ECG records the heart's electrical activity as a graph whose normal components are the P wave, the QRS complex and the T wave.
Electrocardiography is the procedure of recording the electrical changes that occur in the heart muscle during each cardiac cycle. The instrument used is the electrocardiograph, and the graphical record obtained is the electrocardiogram (ECG). Electrodes (leads) placed on the body surface pick up the electrical impulses generated by the heart.
A normal ECG shows the following components:
- P-wave - represents the electrical excitation (depolarisation) of the atria, which leads to their contraction.
- QRS-complex - represents the depolarisation of the ventricles, which initiates ventricular contraction. (Ventricular contraction starts just after the Q wave.)
- T-wave - represents the return of the ventricles to their normal (repolarised) resting state after contraction. …
- CBSE 2018Set ANN2 marksQ.Diagrammatic representation of a standard ECG is given below :a) What does the QRS complex denotes?b) Mention the clinical significance of ECG.
›Reveal solutionSolution
The QRS complex represents ventricular depolarisation; the ECG is a clinical tool for detecting heart disorders.
Diagrammatic presentation standard ecg An electrocardiogram (ECG) is a graphic record of the electrical changes occurring in the heart during a cardiac cycle.
(a) The QRS complex corresponds to the depolarisation (electrical excitation) of the ventricles. This wave of excitation causes the ventricles to contract (ventricular systole).
…
🎓Unlock everything free for 14 days
- ✓Full step-by-step solutions
- ✓Concept-first explanations
- ✓Methods, shortcuts & mistakes
- ✓PYQ mapping + timed mock tests
Full access for 14 days. No credit card required.