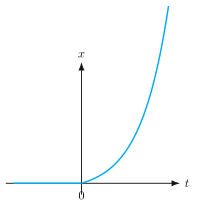
Q.Figure 2.11 shows the x-t plot of one-dimensional motion of a particle. Is it correct to say from the graph that the particle moves in a straight line for t<0 and on a parabolic path for t>0? If not, suggest a suitable physical context for this graph.
🔒You're viewing a preview — the full solution, concept, methods & PYQ mapping are locked.
🔒 Start your 14-day free trial to unlock the full solution →Concept understanding — One Dimensional Motion
One Dimensional Motion
Imagine you're standing on a long, perfectly straight railway track. A train moves along it — it can only go forward or backward. It cannot turn left, right, up, or down. That's the core idea: motion confined to a single straight line.
The Intuition
In the real world, a ball thrown across a room moves in three dimensions — it goes forward, sideways, and up-down. But many problems in physics are simpler. We deliberately restrict motion to one dimension (1D) to understand the fundamental laws without the clutter of angles and curves.
Think of:
- A car moving on a straight highway (no turns).
- A lift going up or down a shaft.
- A ball dropped straight down from a height.
- A puck sliding on a frictionless straight track.
In each case, the object's position can be described by just one number — its distance from a fixed point (the origin) along that line.
The Precise Statement
One Dimensional Motion is motion in which the position of an object can be completely described using a single coordinate axis (usually the x-axis or y-axis). The object moves only along that straight line.
This means:
- The path is a straight line.
- The direction is either positive (say, to the right or upward) or negative (left or downward).
- All vector quantities (displacement, velocity, acceleration) have only two possible directions — forward or backward.
The Three Key Quantities
To describe 1D motion precisely, we use three quantities:
-
Position (x or y) — where the object is relative to the origin.
Example: x=+5 m means 5 metres to the right of the origin.
-
Displacement (Δx) — change in position:
Δx=xfinal−xinitial
This is a vector — it has a sign. If you move from x=2 m to x=7 m, Δx=+5 m. If you move back to x=3 m, Δx=−4 m.
- Velocity (v) — rate of change of position:
v=ΔtΔx
Average velocity has a sign. Instantaneous velocity is the slope of the position-time graph.
- Acceleration (a) — rate of change of velocity:
a=ΔtΔv
Again, a signed quantity. Positive acceleration doesn't always mean speeding up — it means velocity is becoming more positive (or less negative).
The Equations of Motion (Constant Acceleration)
For the special (and very common) case of constant acceleration, we have three equations that connect these quantities. They are the equations of motion for 1D:
v=u+at
s=ut+21at2
v2=u2+2as
Where:
- u = initial velocity
- v = final velocity
- a = constant acceleration
- t = time
- s = displacement
These equations only work when acceleration is constant. If acceleration changes, you cannot use them directly — you'd need calculus or graphical methods.
A Simple Example …
No. An x-t graph is not the actual path of the particle. The motion is one-dimensional (along a straight line) the whole time; the parabolic shape only means x∝t2, i.e. uniform acceleration for t>0.
The curve's shape describes how position changes with time, not the geometric trajectory. Here the particle rests at the origin for t<0 and, from t=0, moves with uniform acceleration (so x=21at2, a parabola on the x-t plot). …
The statement confuses an x-t graph with a spatial trajectory. This is one-dimensional motion, so the particle always moves along one straight line; the graph only tells us how its coordinate x varies with time. Being flat (x=0) for t<0 means it is at rest at the origin, and the parabola for t>0 means x∝t2, i.e. uniformly accelerated motion from rest.
Concept
An x-t graph plots the single coordinate x against time; its shape is not the geometric path travelled through space. In one dimension the path is always a straight line. The graph's slope dtdx is the velocity and its curvature reflects the acceleration.
Why the statement is wrong
- For t<0: x=0 (constant). A horizontal x-t line means zero velocity, i.e. the particle is at rest at the origin. It is not 'moving in a straight line'; it is not moving at all.
- For t>0: x rises as an upward-opening parabola. Comparing with the kinematic equation for constant acceleration from rest,
x=21at2,
the parabolic x-t curve simply signifies uniform acceleration, with velocity v=at increasing linearly. The particle is still moving along the same straight line in space, only speeding up.
A suitable physical context …
Concept: A Graph's Shape Lives in the Plane; the Trajectory Lives on the Line
Method: Domain–Range Mapping Argument (the graph is 2-D; the physical path is 1-D, by definition — no case-by-case sign reasoning needed)
Instead of walking through the flat segment and the rising segment separately and describing what each means physically, this method makes one general observation about any x-t graph of one-dimensional motion, which settles the question immediately and for every possible graph shape, not just this particular parabola-after-a-flat-line one.
Steps
-
Treat position as a function of time, x=f(t). The graph of f is the set of points {(t,f(t))} — this lives in the two-dimensional t-x plane, and its shape can be anything a function's graph can be: straight, curved, parabolic, wavy.
-
The physical trajectory, by contrast, is the RANGE of f — the set {x=f(t):t in the domain}. This is a subset of the real number line (the x-axis alone), because "one-dimensional motion" means, by definition, that the particle's only degree of freedom is its single coordinate x.
-
A subset of a line is always confined to that line, regardless of how curvy the graph of f against t looks. A parabola-shaped x-t graph does not mean a parabola-shaped trajectory — the trajectory can only ever be a stretch of the single x-axis, because there is no second spatial dimension for it to curve into.
-
Apply this to the given graph. For t<0: x=0 (flat line) — range is the single point {0}, i.e. the particle sits at the origin, at rest (zero velocity, since the graph's slope is zero). For t>0: x increases along an upward-curving path that steepens — comparing to x=21at2 (displacement from rest under constant acceleration a), this is the signature of uniformly accelerated motion starting from rest, not a hint about spatial curvature. The RANGE for t>0 is still just an increasing stretch of the same x-axis. …
- AP EAPCET 2026Set eng-2026-05-12-FN1 markMCQQ.If t=Px2+Qx is the relation between time (t) and distance (x), where P and Q are constants, the acceleration is (A) x+Q2P (B) (2Px+Q)3−2P (C) (2Px+Q)3 (D) −2P(2Px+Q)3
›Reveal solutionSolution
With t given as a function of x, velocity is 1/(dt/dx); differentiating again and applying the chain rule gives acceleration =(2Px+Q)3−2P.
Concept and Intuition
When time is expressed as a function of position rather than the usual x(t), we invert the roles: velocity is the reciprocal of dt/dx, and acceleration must be found via the chain rule a=dtdv=dxdv⋅dtdx=dxdv⋅v.
Step-by-Step Solution
- t=Px2+Qx⇒dxdt=2Px+Q.
- Velocity: v=dtdx=2Px+Q1=(2Px+Q)−1.
- Differentiate v with respect to x: dxdv=−1⋅(2Px+Q)−2⋅2P=(2Px+Q)2−2P. …
- AP EAPCET 2026Set eng-2026-05-14-AN1 markMCQQ.If a=−kv represents the variation of acceleration of a particle with velocity, time taken to reduce the velocity from v to v/2 is (A) kln2 (B) 2k1 (C) 2kln2 (D) k2
›Reveal solutionSolution
Velocity-dependent deceleration leads to exponential decay of velocity; the time to halve the velocity is kln2 — a 'half-life' type result.
Concept and Intuition
When acceleration is proportional to velocity (and opposing it), the velocity decays exponentially with time, exactly like radioactive decay or RC discharge. There's no fixed 'half life' formula to memorize here for arbitrary factors — we derive it directly from the differential equation.
Step-by-Step Solution
- Start with a=dtdv=−kv.
- Separate variables: vdv=−kdt.
- Integrate both sides from initial velocity v0=v (at t=0) to v/2 (at time t): ∫vv/2v′dv′=−k∫0tdt′
- LHS: ln(v/2)−ln(v)=ln(1/2)=−ln2.
- RHS: −kt. …
- AP EAPCET 2026Set eng-2026-05-15-AN1 markMCQQ.Acceleration varies as a=6t, starting from rest, velocity after t=2 s (A) 6 ms−1 (B) 12 ms−1 (C) 18 ms−1 (D) 24 ms−1
›Reveal solutionSolution
This tests integrating a time-varying acceleration to find velocity. The answer is (B), 12ms−1.
Concept and Intuition
When acceleration is not constant but a known function of time, velocity is obtained by integrating a(t) with respect to time, using the initial condition to fix the constant of integration.
Step-by-Step Solution
- Given a=dtdv=6t.
- Integrate both sides: v(t)=∫6tdt=3t2+C.
- Since the particle starts from rest, v(0)=0⇒C=0.
- So v(t)=3t2.
- At t=2s: v=3(2)2=3×4=12ms−1.
Common Mistakes …
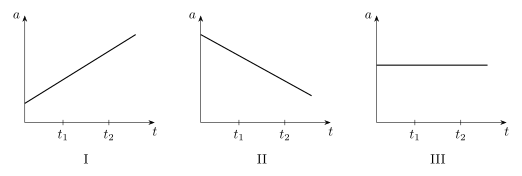
- AP EAPCET 2026Set eng-2026-05-15-FN1 markMCQQ.The three graphs represent acceleration Vs time for objects that have positive velocity at time t1. Which graphs show the objects that move with increasing velocity for the entire time interval between t1 and t2? [FIGURE: three acceleration(a)-vs-time(t) graphs labelled I, II, III, each marked with points t1 and t2 on the time axis — Graph I is a straight line with positive slope (increasing); Graph II is a straight line with negative slope (decreasing); Graph III is a horizontal line (constant)] (A) I only (B) I and II only (C) III only (D) I, II and III
›Reveal solutionSolution
Velocity increases on an interval exactly when acceleration is positive there — the trend of the acceleration (rising, falling, or flat) is irrelevant to whether v is increasing, only its sign matters. All three graphs stay positive across [t1,t2], so all three show increasing velocity.
Concept and Intuition
A very common mix-up is to think "acceleration is decreasing, so the object must be slowing down." That confuses the rate of change of velocity with velocity itself. As long as a(t)=dtdv>0, v is climbing — even if a itself is falling, the velocity is still gaining, just gaining more slowly near t2 than near t1. The object only starts to slow down once a actually crosses to negative values.
Step-by-Step Solution
- Velocity at t2 compared to t1 is given by v(t2)=v(t1)+∫t1t2adt. The integral (area under the a–t curve) is positive as long as a(t)≥0 throughout [t1,t2], and it is positive definite (strictly increasing v) as long as a(t)>0 almost everywhere in that interval.
- Graph I: straight line, positive slope, a>0 at t=0 and growing — clearly a>0 on all of [t1,t2]. So v increases, and increases at a growing rate. …
- AP EAPCET 2024Set ap-2024-05-17-AN1 markMCQQ.The displacement 'x' of a particle moving in one direction is given by t=x+3, where 'x' is in metre and 't' is in second. Its displacement when its velocity becomes zero is (A) 3 m (B) 2 m (C) 1 m (D) Zero
›Reveal solutionSolution
Inverting the given t–x relation gives x=(t−3)2; differentiating and setting velocity to zero shows the particle is exactly at x=0 at that instant.
Concept and Intuition
When a relation is given as t in terms of x rather than the usual x(t), first invert it to get x as an explicit function of t, then differentiate normally to get velocity as a function of time.
Step-by-Step Solution
- t=x+3⇒x=t−3⇒x=(t−3)2.
- v=dtdx=2(t−3).
- v=0⇒t=3 s.
- Substitute back: x=(3−3)2=0 m.
Common Mistakes …
- AP EAPCET 2024Set eng-2024-05-21-AN1 markMCQQ.The velocity of a particle is given by the equation v(x)=3x2−4x, where 'x' is the distance covered by the particle. The expression for its acceleration is (A) (6x−4) (B) 6(3x2−4x) (C) (3x2−4x)(6x−4) (D) (6x−4)2
›Reveal solutionSolution
Using a=vdxdv with v=3x2−4x, the acceleration is (3x2−4x)(6x−4).
Concept and Intuition
When velocity is given as a function of position rather than time, acceleration is found via the chain rule a=dtdv=dxdv⋅dtdx=vdxdv — never simply dv/dx alone.
Step-by-Step Solution
- v(x)=3x2−4x.
- dxdv=6x−4.
- a=vdxdv=(3x2−4x)(6x−4).
Common Mistakes …
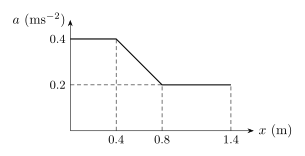
- AP EAPCET 2024Set eng-2024-05-21-AN1 markMCQQ.The acceleration of a particle which moves along the positive x-axis varies with its position as shown in the figure. [FIGURE] (a graph of acceleration a (in ms−2) vs position x (in m): a=0.4 constant from x=0 to x=0.4, then decreasing linearly to a=0.2 at x=0.8, then constant at a=0.2 from x=0.8 to x=1.4) If the velocity of the particle is 0.8 ms−1 at x=0, then its velocity at x=1.4 m is (in ms−1) (A) 1.6 (B) 1.2 (C) 1.4 (D) 0.8
›Reveal solutionSolution
The area under the given acceleration-vs-position graph from x=0 to x=1.4 is 0.40 m2/s2; combined with v(0)=0.8, this gives v(1.4)=1.2 m/s.
Concept and Intuition
Since a=vdxdv, we have vdv=adx, so integrating both sides: 2vf2−vi2=∫adx=area under the a–x graph. This lets us read the answer directly off the graph's geometry without needing a(t).
Step-by-Step Solution
- Break the a–x graph into three regions and find each area:
- x=0 to 0.4: rectangle, a=0.4, area =0.4×0.4=0.16.
- x=0.4 to 0.8: trapezoid from a=0.4 down to a=0.2, width 0.4: area =20.4+0.2×0.4=0.12.
- x=0.8 to 1.4: rectangle, a=0.2, width 0.6: area =0.2×0.6=0.12.
- Total area =0.16+0.12+0.12=0.40. …
- Break the a–x graph into three regions and find each area:
- AP EAPCET 2022Set eng-2022-07-07-FN1 markMCQQ.A particle is moving along x-axis with velocity v=e−βx. At time t=0, the particle is located at x=0. The displacement of the particle as function of time is (A) e−βt (B) β1e(1−βt) (C) β1log[1−βt] (D) β1log[1+βt]
›Reveal solutionSolution
Separating variables in dtdx=e−βx and applying x(0)=0 gives x(t)=β1ln(1+βt).
Concept and Intuition
This is a separable first-order ODE relating velocity to position. Rearrange so all x-terms are on one side and t-terms on the other, then integrate and apply the initial condition to fix the constant.
Step-by-Step Solution
- v=dtdx=e−βx.
- Separate variables: eβxdx=dt.
- Integrate both sides: ∫eβxdx=∫dt⇒β1eβx=t+C.
- Apply x=0 at t=0: β1e0=0+C⇒C=β1.
- So β1eβx=t+β1⇒eβx=βt+1. …
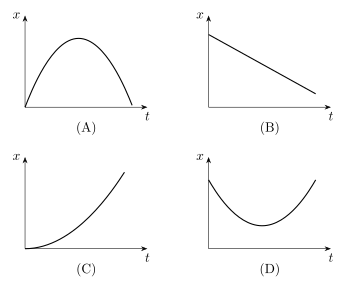
- AP EAPCET 2022Set eng-2022-07-08-FN1 markMCQQ.The correct position(x) – time (t) graph for a particle moving with negative acceleration is (A) [FIGURE] (an x-t graph shaped like an inverted-U / downward-opening curve: x rises from the origin, reaches a peak, then falls back down towards the t-axis) (B) [FIGURE] (an x-t graph that is a straight line with negative slope, x decreasing linearly with time from a positive starting value) (C) [FIGURE] (an x-t graph that curves upward with increasing slope, concave up, rising steeply from the origin) (D) [FIGURE] (an x-t graph shaped like a U / upward-opening curve: x starts high, decreases to a minimum, then increases again, concave up)
›Reveal solutionSolution
Negative (constant) acceleration means the x–t graph must be concave DOWN; among the four described graphs, only the dome-shaped curve (A) is concave down.
Concept and Intuition
The second derivative of x with respect to t is the acceleration: a=d2x/dt2. So the sign of acceleration directly controls the concavity (curvature) of the position-time graph, not its slope's sign. A negative acceleration means the graph curves downward (concave down) everywhere, like x=v0t−21∣a∣t2, a downward parabola. A straight line has zero curvature (zero acceleration) regardless of its slope.
Step-by-Step Solution
- For constant acceleration a (here a<0), position is x(t)=x0+v0t+21at2.
- Since a<0, the coefficient of t2 is negative, so the curve is a downward-opening parabola — concave down everywhere.
- Evaluate each option:
- (A) Dome/inverted-U starting at the origin, rising to a peak, then falling: this is exactly a downward parabola through the origin — concave down. ✓
- (B) Straight line with negative slope: d2x/dt2=0 (zero acceleration, just negative velocity). ✗ …
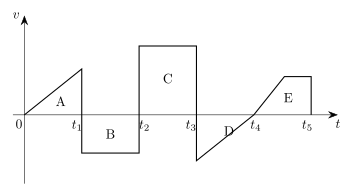
- AP EAPCET 2021Set ap-2021-09-06-FN1 markMCQQ.The velocity-time graph of an object is as shown. [FIGURE] (a v-t graph with axes v vs t, showing five labelled regions in order along the t-axis: A - a rising straight line from the origin up to t1, above the axis; B - a rectangular region below the t-axis from t1 to t2; C - a rectangular region above the t-axis from t2 to t3; D - a straight line sloping below the t-axis from t3 to t4; E - a trapezoidal region above the t-axis from t4 to t5) The displacement during the interval 0 to t4 is ____ (A) area(A) + area(B) + area(C) + area(D) + area(E) (B) area(A) - area(B) + area(C) - area(D) (C) area(A) + area(B) + area(C) + area(D) (D) area(A) - area(B) + area(C) + area(D) + area(E)
›Reveal solutionSolution
Displacement is the net area between the velocity-time graph and the time axis, counting area above the axis as positive and area below as negative. For the interval 0 to t₄, only regions A, B, C, and D lie within that time span; region E is after t₄ and does not contribute. The correct expression is area(A) − area(B) + area(C) − area(D), which matches option (B).
The key idea is simple: on a velocity-time graph, displacement equals the signed area — area above the time axis is positive (motion forward), area below is negative (motion backward). The question asks for displacement from 0 to t₄, so we only consider regions that fall within that time interval. Region E lies entirely after t₄, so it is irrelevant.
Let’s walk through it step by step.
-
Identify which regions lie between 0 and t₄.
The time axis is marked 0, t₁, t₂, t₃, t₄, t₅.
- Region A: from 0 to t₁ (above axis) → inside interval.
- Region B: from t₁ to t₂ (below axis) → inside interval.
- Region C: from t₂ to t₃ (above axis) → inside interval.
- Region D: from t₃ to t₄ (below axis) → inside interval.
- Region E: from t₄ to t₅ (above axis) → outside the interval 0 to t₄. So only A, B, C, D matter.
-
Assign signs to each region.
Displacement = sum of signed areas.
- Above axis → positive: A and C.
- Below axis → negative: B and D. Therefore, displacement = +A−B+C−D.
-
Check the options.
- (A) includes E, which is wrong.
- (B) is exactly A−B+C−D — correct.
- (C) treats B and D as positive, which is wrong. …
-
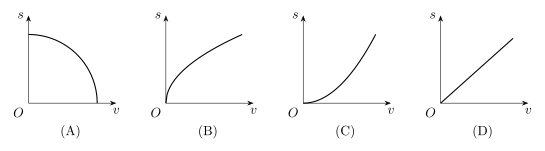
- AP EAPCET 2021Set eng-2021-08-20-AN1 markMCQQ.An object is moving with a uniform acceleration which is parallel to its instantaneous direction of motion. The displacement(s) – velocity(v) graph of this object is _______ (A) [FIGURE] (a curve starting high on the s-axis at v=0 and curving down like a quarter-circle to meet the v-axis) (B) [FIGURE] (a curve starting at the origin, rising quickly then flattening out — concave down, like a square-root curve) (C) [FIGURE] (a curve starting at the origin and rising with increasing steepness — concave up, like a parabola opening upward) (D) [FIGURE] (a straight line through the origin)
›Reveal solutionSolution
This tests the kinematic relation v2=2as for uniformly accelerated motion from rest, and translating it into the shape of the s–v graph. The answer is the upward-opening parabola through the origin, option (C).
Concept and Intuition
For 1-D motion with constant acceleration a starting from rest (u=0) at s=0, the kinematic equation v2=u2+2as reduces to v2=2as, i.e. s=2av2. This says s is proportional to v2, not to v — so on an s (vertical) vs. v (horizontal) graph, we get a parabola opening upward through the origin, not a straight line, and it gets steeper (not flatter) as v grows.
Step-by-Step Solution
- The object starts at s=0 with v=0 and undergoes constant acceleration a along its direction of motion.
- Kinematics: v2=u2+2as=2as (since u=0).
- Solve for s: s=2av2, i.e. s is a quadratic (parabolic) function of v.
- Since the coefficient 1/(2a) is positive, the parabola opens upward, passing through the origin, and its slope ds/dv=v/a increases as v increases — i.e., it curves upward more steeply, not flattening out. …
🎓Unlock everything free for 14 days
- ✓Full step-by-step solutions
- ✓Concept-first explanations
- ✓Methods, shortcuts & mistakes
- ✓PYQ mapping + timed mock tests
Full access for 14 days. No credit card required.