Q.Consider a market consisting of identical farms producing the same quality of wheat. Suppose the market demand curve and the market supply curve for wheat are given by for and for ; for and for , where and denote the demand for and supply of wheat (in kg) respectively and denotes the price of wheat per kg in rupees. Find the equilibrium price and quantity, and examine the situation at prices below and above the equilibrium price.
Market equilibrium occurs where quantity demanded equals quantity supplied. For this wheat market, equilibrium price is ₹40 per kg and equilibrium quantity is 160 kg. At prices below ₹40, there is excess demand; at prices above ₹40, there is excess supply.
The Core Idea: Market Demand Aggregation
A market reaches equilibrium when the plans of buyers and sellers are mutually consistent — that is, when the quantity consumers want to buy exactly matches the quantity producers want to sell. This is not a coincidence; it is the natural outcome of price adjustment. If price is too high, unsold stock piles up and sellers cut price; if price is too low, queues form and buyers bid price up. Only at the equilibrium price do both sides feel satisfied.
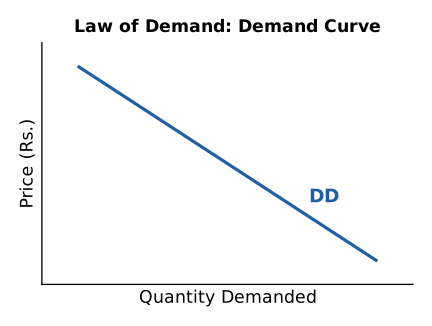
Here, we have a perfectly competitive market for wheat. All farms are identical and produce homogeneous wheat, so no single buyer or seller can influence price. The market demand curve tells us that as price rises, quantity demanded falls — a standard downward-sloping demand curve. The market supply curve (for ) tells us that as price rises, quantity supplied rises — an upward-sloping supply curve.
Equilibrium condition:
Step-by-Step Working
Step 1: Set quantity demanded equal to quantity supplied.
Since both and are expressed in terms of , we write:
Step 2: Solve for .
Bring terms involving to one side:
So the equilibrium price is ₹40 per kg.
Step 3: Find equilibrium quantity.
Substitute into either the demand or supply equation. Using demand:
Using supply:
Both give the same result. Equilibrium quantity is 160 kg.
Equilibrium price is per kg and equilibrium quantity is .
What Happens Away from Equilibrium?
At a price below equilibrium, say ₹30:
Demand: kg
Supply: kg
Excess demand = kg. Buyers want more wheat than sellers are willing to supply. This shortage puts upward pressure on price — buyers compete, and price rises toward ₹40.
At a price above equilibrium, say ₹50:
Demand: kg
Supply: kg
Excess supply = kg. Sellers cannot sell all their wheat. This surplus forces price downward as sellers undercut each other, again moving toward ₹40.
A common mistake is to forget the supply curve's kink: supply is zero for . At any price below ₹10, no wheat is produced at all, so excess demand would be the entire quantity demanded. But since equilibrium price ₹40 is well above ₹10, this kink does not affect the equilibrium calculation.
The demand curve is defined only for ; beyond ₹200, demand is zero. The equilibrium price ₹40 lies comfortably within this range, so the demand function is valid.
Conclusion
The market clears at ₹40 per kg with 160 kg of wheat traded. Any deviation from this price creates either excess demand (shortage) or excess supply (surplus), and the price mechanism automatically pushes the market back to equilibrium. This is the invisible hand at work in a competitive market.
Unlock everything free for 14 days
- Full step-by-step solutions
- Concept-first explanations
- Methods, shortcuts & mistakes
- PYQ mapping + timed mock tests
Full access for 14 days. No credit card required.