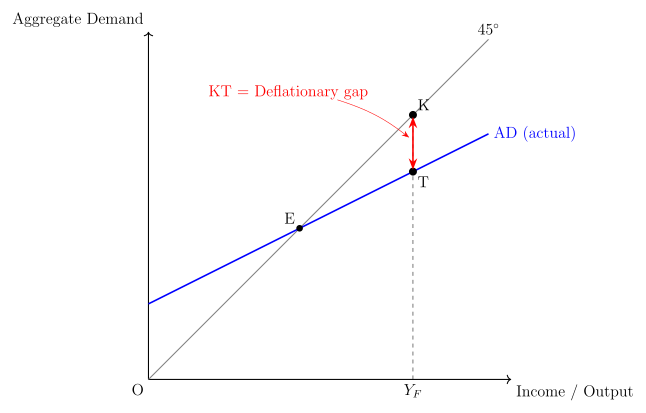
Q.In the given figure, what does the gap ‘KT’ represent ? State and discuss any two fiscal measures to correct the situation. For Visually Impaired Candidates : What is meant by deflationary gap ? State and discuss any two fiscal measures to correct the situation of deflationary gap.
You're viewing a preview — the full solution, concept, methods & PYQ mapping are locked.
Start your 14-day free trial to unlock the full solution →The gap ‘KT’ represents a deflationary gap (or recessionary gap) — the shortfall of aggregate demand below the full-employment output level. Two fiscal measures to correct it are: (1) increasing government expenditure, and (2) reducing taxes.
The Concept: What is a Deflationary Gap?
A deflationary gap occurs when the economy’s actual aggregate demand is less than the aggregate demand needed to achieve full-employment equilibrium. In other words, people, firms, and the government are not spending enough to buy all the goods and services the economy is capable of producing at full employment.
In the figure (which you’ve described), the vertical axis likely shows aggregate demand (or expenditure), and the horizontal axis shows national income/output. The 45° line represents points where aggregate demand equals output. The line ‘KT’ is the vertical distance between the actual aggregate demand curve (which lies below the 45° line at full-employment output) and the 45° line itself. That vertical gap is the deflationary gap — the amount by which spending must rise to reach full employment.
A common mistake is to confuse a deflationary gap with a recession. The gap is the shortfall in spending, not the recession itself. The recession (falling output and rising unemployment) is the consequence of the gap.
Step-by-Step Explanation
-
Identify the gap ‘KT’
In the diagram, point ‘K’ lies on the 45° line at the full-employment output level (). Point ‘T’ lies on the actual aggregate demand curve (say, ) vertically below ‘K’. The distance KT is the deflationary gap — the excess of required aggregate demand over actual aggregate demand at full employment.
-
Why does this gap matter?
When aggregate demand is insufficient, firms cannot sell all they produce at full employment. They cut back production, leading to unemployment and falling prices (deflation). The economy operates below its potential — a classic recessionary scenario.
-
How can fiscal policy close this gap?
Fiscal policy uses the government’s budget — spending and taxes — to influence aggregate demand. Since the problem is too little demand, the solution is expansionary fiscal policy: increase spending or cut taxes (or both).
Two Fiscal Measures to Correct a Deflationary Gap
1. Increase Government Expenditure
The government can directly boost aggregate demand by spending more on infrastructure, public works, defence, education, or health. This injection of spending raises total expenditure in the economy.
-
How it works:
Suppose the government spends ₹100 crore on building roads. This directly increases aggregate demand by ₹100 crore. But the effect doesn’t stop there — the workers and suppliers who receive this money spend a portion of it on other goods, creating a multiplier effect. The final increase in national income is larger than the initial spending.
-
Multiplier formula:
where is the marginal propensity to consume. If , the multiplier is 5, so ₹100 crore of government spending raises income by ₹500 crore.
- Why it’s effective: It directly fills the demand gap and can be targeted at sectors with high unemployment.
In a deep recession, the multiplier is often larger because people spend a higher fraction of any extra income (they have pent-up needs). So government spending packs a bigger punch when the gap is wide.
2. Reduce Taxes
Cutting taxes (direct taxes like income tax, or indirect taxes like GST) leaves more disposable income in the hands of households and firms. This encourages higher consumption and investment spending.
-
How it works:
A tax cut of ₹100 crore increases disposable income by ₹100 crore. Households spend a fraction of this (say, 80% if MPC = 0.8), so consumption rises by ₹80 crore initially. This spending then ripples through the economy via the multiplier.
-
Multiplier for tax cut: …
Unlock everything free for 14 days
- Full step-by-step solutions
- Concept-first explanations
- Methods, shortcuts & mistakes
- PYQ mapping + timed mock tests
Full access for 14 days. No credit card required.