Geography · Ch 18 — Water (Oceans)
Horizontal and Vertical Distribution of Temperature
Horizontal and Vertical Distribution of Temperature
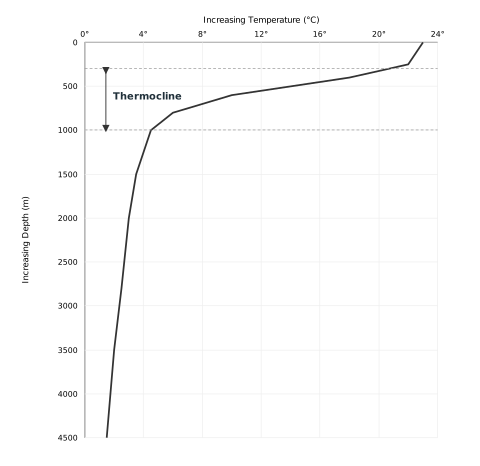
The diagram is a single line graph, and its job is to show you how ocean temperature behaves as you go deeper. The horizontal axis carries Increasing Temperature, marked from 0°C up to 24°C. The vertical axis carries Increasing Depth, but it is inverted — depth grows downward, so the surface sits at the top of the graph and the sea floor at the bottom. That inversion is the whole trick of the figure: you read it like a cross-section of the ocean, with the warm sunlit surface at the top and the cold abyss below.
The curve itself tells a three-part story. It begins at the surface near 22–24°C and holds almost steady through the first 300 m — that flat, warm stretch is the shallow surface layer, where sunlight keeps the water well mixed and uniformly warm. Then, between roughly 300 m and 1000 m, the line plunges almost vertically. This steep drop is the thermocline, and the diagram labels that band explicitly. Below 1000 m the curve flattens out again, easing gradually toward 0–4°C as it descends to 4500 m. That long, gentle tail is the deep cold water that fills most of the ocean's volume.
What the graph teaches is that temperature does not decrease uniformly with depth — it collapses in one narrow zone and is nearly constant everywhere else. The thermocline is that boundary region where the rapid decrease happens, and it acts as a lid separating warm surface water from the cold deep ocean. Notice the asymmetry: the warm layer is thin, the thermocline is a sharp transition, and the cold layer below is enormous. That is why the textbook says about 90 per cent of ocean water sits below the thermocline — the graph makes that visually obvious, because the curve spends most of its vertical travel in the cold, nearly flat zone. …
The map is a world map, with the ocean surface shown in place of the usual land-focused view. The key elements are the isotherms — lines joining points of equal surface temperature — drawn across the Atlantic, Pacific, and Indian Oceans. Each line is labelled with a temperature in degrees Celsius: 0, 5, 10, 15, 20, 25, and 28. These lines run roughly parallel to the latitude circles, which is the first thing the diagram teaches: ocean surface temperature is primarily a function of latitude, not of longitude or distance from land.
The warmest water, at 28°C, sits near the equator, but not exactly on it. The description places this maximum in the Indian and Pacific Oceans, slightly north of the equator — matching the text's point that the highest temperature is not at the equator itself. From this warm core, the isotherms step down symmetrically toward both poles: 25°C, then 20°C, 15°C, 10°C, 5°C, and finally 0°C near the Arctic and Antarctic circles. The pattern is a steady, poleward cooling, with no sudden jumps or closed loops of warm or cold water interrupting the general trend.
What the diagram teaches is the horizontal distribution of ocean surface temperature. It visualises the text's key figures: the average surface temperature of about 27°C, the gradual decrease from equator to poles, and the rate of roughly 0.5°C per degree of latitude. You can read the isotherms as a contour map of that gradient — closely spaced lines would mean a rapid temperature change, widely spaced lines a gentle one. The diagram also shows the asymmetry the text mentions: the northern hemisphere oceans run warmer than the southern at corresponding latitudes, a consequence of the unequal distribution of land and water between the two hemispheres. The 0°C isotherm reaches farther toward the equator in the south, reflecting the colder southern oceans. …
The ocean is not uniformly cold or warm. Its temperature changes with depth, and it also changes across latitudes. Both patterns — the vertical one (depth-wise) and the horizontal one (latitude-wise) — are governed by how sunlight heats the surface and how that heat is carried downward.
Vertical Distribution of Temperature
If you plot temperature against depth, you get a temperature-depth profile that shows temperature falling as depth increases. The fall is not smooth or steady. Instead, the profile reveals a distinct boundary region between the warm surface waters and the colder deeper layers. This boundary usually begins around 100–400 m below the sea surface and extends several hundred metres further downward.
This boundary region, where temperature drops rapidly with depth, is called the thermocline. It is the zone of sharpest temperature change in the ocean.
About 90 per cent of the total volume of ocean water lies below the thermocline, in the deep ocean, where temperatures approach 0°C.
The Three-Layer System
Over middle and low latitudes, the vertical temperature structure of the ocean can be described as a three-layer system from surface to bottom:
| Layer | Characteristic |
|---|---|
| First layer | Warm surface water, about 500 m thick, with temperatures between 20°C and 25°C |
| Second layer | The thermocline, 500–1,000 m thick, marked by a rapid decrease in temperature with depth |
| Third layer | Very cold water extending down to the deep ocean floor |
The warm top layer behaves differently by region. Within the tropics, it is present throughout the year. In mid-latitudes, however, it develops only during summer.
The Polar Exception
In the Arctic and Antarctic circles, the situation is entirely different. Surface water temperatures there are close to 0°C, so the temperature change with depth is very slight. Instead of three layers, only one layer of cold water exists, extending from the surface all the way to the deep ocean floor.
Horizontal Distribution of Temperature
The average temperature of the surface water of the oceans is about 27°C, and it gradually decreases from the equator towards the poles. The rate of decrease with increasing latitude is generally 0.5°C per degree of latitude.
The book gives these average values at specific latitudes:
- Around 22°C at 20° latitudes
- Around 14°C at 40° latitudes
- Around 0°C near the poles
Two notable asymmetries emerge. First, the oceans of the northern hemisphere record relatively higher temperatures than those of the southern hemisphere. The average annual temperatures are around 19°C for the northern hemisphere and 16°C for the southern hemisphere. Second, the highest temperature is not recorded exactly at the equator but slightly north of it. …
The temperature-depth profile for the ocean water shows how the temperature decreases with the increasing depth. The profile shows a boundary region between the surface waters of the ocean and the deeper layers. The boundary usually begins around 100-400 m below the sea surface and extends several hundred of metres downward. This boundary region, from where there is a rapid decrease of temperature, is called the thermocline. About 90 per cent of the total volume of water is found below the thermocline in the deep ocean. In this zone, temperatures approach 0 degree C.
The temperature structure of oceans over middle and low latitudes can be described as a three-layer system from surface to the bottom. The first layer represents the top layer of warm oceanic water and it is about 500m thick with temperatures ranging between 20 and 25 degree C. This layer, within the tropical region, is present throughout the year but in mid latitudes it develops only during summer. The second layer called the thermocline layer lies below the first layer and is characterised by rapid decrease in temperature with increasing depth. The thermocline is 500-1,000 m thick. The third layer is very cold and extends upto the deep ocean floor. In the Arctic and Antartic circles, the surface water temperatures are close to 0 degree C and so the temperature change with the depth is very slight. Here, only one layer of cold water exists, which extends from surface to deep ocean floor.
The average temperature of surface water of the oceans is about 27 degree C and it gradually decreases from the equator towards the poles. The rate of decrease of temperature with increasing latitude is generally 0.5 degree C per latitude. The average temperature is around 22 degree C at 20 degree latitudes, 14 degree C at 40 degree latitudes and 0 degree C near poles. The oceans in the northern hemisphere record relatively higher temperature than in the southern hemisphere. The highest temperature is not recorded at the equator but slightly towards north of it. The average annual temperatures for the northern and southern hemisphere are around 19 degree C and 16 degree C respectively. This variation is due to the unequal distribution of land and water in the northern and southern hemispheres. …