Computer Science · Ch 4 — Introduction to Problem Solving
Pseudocode
Pseudocode
A pseudocode (pronounced Soo-doh-kohd) is the second common way of representing an algorithm. It is a non-formal language that helps programmers write algorithms: a detailed description of the instructions a computer must follow, in a particular order. Two properties define it:
- it is meant for human reading — a computer cannot execute pseudocode directly, and
- no specific standard exists for writing it; the writer is free to choose sensible wording as long as the steps stay clear and ordered.
The name itself says so: "pseudo" means "not real", so pseudocode is "not real code".
Frequently used keywords
Although there is no fixed standard, some keywords recur in almost all pseudocode:
INPUT— accept a valueCOMPUTE— perform a calculationPRINT— display a resultINCREMENT— increase a valueDECREMENT— decrease a valueIF/ELSE— decision-makingWHILE— repetitionTRUE/FALSE— the two binary truth values
Example 4.3 — sum of two numbers (pseudocode and flowchart)
Task: display the sum of two numbers entered by the user.
INPUT num1
INPUT num2
COMPUTE Result = num1 + num2
PRINT Result
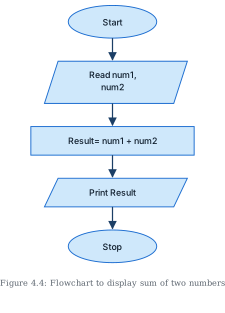
The matching flowchart (Figure 4.4) is a simple linear chain: Start → read num1 and num2 (input parallelogram) → compute Result = num1 + num2 (process rectangle) → print Result (output parallelogram) → Stop.
Example 4.4 — area and perimeter of a rectangle
Task: calculate both the area and the perimeter of a rectangle from its length and breadth.
INPUT length
INPUT breadth
COMPUTE Area = length * breadth
PRINT Area
COMPUTE Perim = 2 * (length + breadth)
PRINT Perim
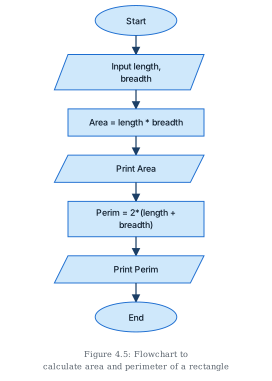
The flowchart (Figure 4.5) again runs straight top-to-bottom, alternating process and output boxes: input the two measurements, compute and print the area, then compute and print the perimeter. Both examples execute strictly in sequence — an observation section 4.5.1 returns to.
(A) Benefits of pseudocode
Writing pseudocode before writing code in a high level language pays off in two ways: …
Drawn by us to help you understand the concept clearly, and verified to make sure it's accurate. For exams, practice from your NCERT textbook's own diagram.
Figure 4.4 is the flowchart companion to Example 4.3, whose pseudocode reads two numbers, computes their sum and prints the result. Like Figure 4.2, it is a simple linear flowchart — top to bottom, all arrows unlabelled — because the algorithm is pure sequence with no decisions.
Its five nodes, in order:
- Oval 'Start' — the entry terminator.
- Parallelogram (input) 'Read num1, num2' — both numbers are read from the user in one input step (the label wraps onto two lines in the figure: "Read num1," / "num2"). This corresponds to the pseudocode's two INPUT lines,
input num1andinput num2. - Rectangle (process) 'Result= num1 + num2' — the single computation: the two numbers are added and the sum stored in
Result(the pseudocode'sCOMPUTE Result = num1 + num2). - Parallelogram (output) 'Print Result' — the sum is displayed (
PRINT Result). - Oval 'Stop' — the exit terminator.
The arrows run straight down through all five nodes: Start → Read num1, num2 → Result = num1 + num2 → Print Result → Stop. …
Drawn by us to help you understand the concept clearly, and verified to make sure it's accurate. For exams, practice from your NCERT textbook's own diagram.
Figure 4.5 draws the flowchart for Example 4.4 — calculating both the area and the perimeter of a rectangle from its length and breadth. It is again a linear, top-to-bottom flowchart with unlabelled arrows: sequence only, no branching, but this time with two compute-and-print pairs chained one after the other.
The seven nodes, in order:
- Oval 'Start' — entry terminator.
- Parallelogram (input) 'Input length, breadth' — both dimensions are read in one input step (matching the pseudocode's
input lengthandinput breadth). - Rectangle 'Area = length * breadth' — the first computation: the area.
- Parallelogram (output) 'Print Area' — the area is displayed immediately.
- Rectangle 'Perim = 2(length + breadth)'* — the second computation: the perimeter.
- Parallelogram (output) 'Print Perim' — the perimeter is displayed.
- Oval 'End' — the closing terminator. Note the wording: this chart's final oval says 'End', not 'Stop' — a reminder that terminator text is not standardised; the oval shape itself is what signals termination.
The flow runs straight down: Start → Input → Area → Print Area → Perim → Print Perim → End. …