Chemistry · Ch 5 — Coordination Compounds
Colour in Coordination Compounds
Colour in Coordination Compounds
One of the most striking features of transition metal complexes is the sheer range of colours they display. A coloured substance is, physically, one that removes part of the visible spectrum from white light as the light passes through it — what reaches the eye is no longer white, but whatever wavelengths were not absorbed. The colour actually seen is therefore the complementary colour to the one absorbed: the colour generated by the leftover, unabsorbed wavelengths. For example, if a complex absorbs green light, what emerges — and what we see — is red.
(The observed relationship between the specific wavelength absorbed and the resulting colour, for a set of representative coordination entities, is tabulated separately — see the accompanying table card; not reproduced here.)
| Coordination entity | Wavelength of light absorbed (nm) | Colour of light absorbed | Colour of coordination entity |
|---|---|---|---|
| 535 | Yellow | Violet | |
| 500 | Blue Green | Red | |
| 475 | Blue | Yellow Orange | |
| 310 | Ultraviolet (not in visible region) | Pale Yellow |
The CFT explanation: d–d transitions
Crystal Field Theory explains this absorption directly in terms of the -orbital splitting developed in the previous section. Because the orbitals of the metal are split into sets of different energy (e.g. and in an octahedral field), an electron can absorb a photon of just the right energy to jump from the lower-energy set to the higher-energy set — a – transition.
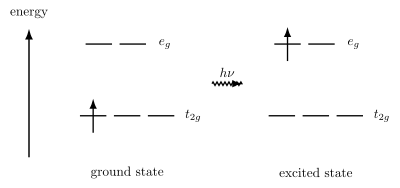
Consider , an octahedral complex that appears violet. is a ion, so in the ground state its single electron sits in the lower level; the next available state is the empty, higher-energy level. When the complex absorbs light in the blue-green region of the visible spectrum, that photon supplies exactly the energy needed to promote the electron:
Having absorbed the blue-green component of white light, the complex transmits/reflects the remaining wavelengths, which combine to give the violet colour actually observed.
Drawn by us to help you understand the concept clearly, and verified to make sure it's accurate. For exams, practice from your NCERT textbook's own diagram.
The figure is an energy-level diagram for a octahedral complex (like ). It shows two horizontal lines representing the two sets of orbitals split by the crystal field:
- The lower line is labelled (the three orbitals).
- The higher line is labelled (the two orbitals).
The vertical separation between these two lines is the crystal field splitting energy, denoted (or for octahedral).
On the lower line, a single arrow (representing the one electron of ) points upward toward the line. A wavy arrow (representing a photon of light) is drawn from the electron to the level, with the label beside it.
What the diagram teaches:
In the ground state, the single electron occupies the lower-energy set. When the complex absorbs a photon whose energy exactly equals , the electron is promoted to the empty level — this is a – transition (). The colour we see is the complement of the colour absorbed.
Key formula developed from this figure:
where:
- = Planck’s constant ()
- = frequency of the absorbed light (in or Hz)
- = crystal field splitting energy for an octahedral complex (in joules or ) …
In short, CFT attributes the colour of coordination compounds to – electronic transitions driven by the crystal-field splitting of the orbitals — something Valence Bond Theory, which treats the -derived hybrid orbitals as equivalent, has no way of explaining.
No ligand field, no splitting, no colour
If there is no ligand field around the metal, there is no crystal field splitting — and therefore no – transition is possible, so the substance is colourless. This is confirmed experimentally: removing the water ligands from by heating leaves it colourless, and anhydrous (with no ligands bound to the copper) is white, whereas hydrated (with water ligands present) is blue.
The ligand itself changes the colour
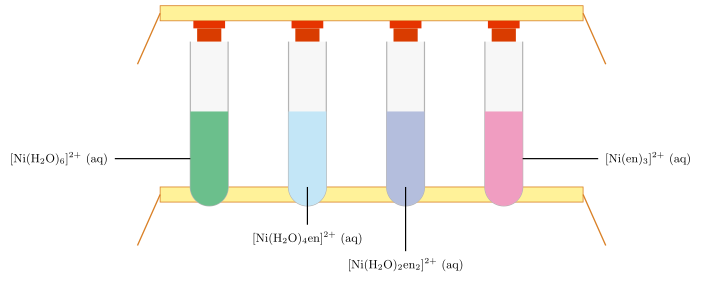
Because the size of the crystal field splitting depends on the ligand (via the spectrochemical series), changing the ligand on the same metal changes the colour — even though the metal ion and its oxidation state stay the same. This is illustrated by progressively adding the didentate ligand ethane-1,2-diamine (en) to aqueous , in molar ratios of en : Ni of 1:1, 2:1, and 3:1. The successive substitution steps, with the colour of each species written beneath it, are:
As each water pair is successively replaced by en, the colour of the solution shifts visibly through a sequence — from the green of the starting hexaaqua ion, through pale blue and then blue/purple as one and then two en ligands are incorporated, to the violet of the fully substituted . Each step in this substitution sequence changes the crystal field experienced by the nickel ion, which shifts the energy of the – transition and therefore the wavelength absorbed — and so the observed colour changes at every stage.
Drawn by us to help you understand the concept clearly, and verified to make sure it's accurate. For exams, practice from your NCERT textbook's own diagram.
The figure shows four test tubes lined up side by side, each containing an aqueous solution of a nickel(II) complex. The tubes are labelled with the formula of the complex and show a distinct colour:
- First tube: — green
- Second tube: — pale blue
- Third tube: — blue/purple
- Fourth tube: — violet
The horizontal axis (implicitly) runs from left to right, representing increasing number of ethane-1,2-diamine (en) ligands replacing water molecules. There is no vertical axis — the figure is a photograph of solutions, not a plot. The key physical idea is that as the stronger-field ligand en replaces the weaker-field ligand , the crystal field splitting parameter increases. A larger means the – transition absorbs light of shorter wavelength (higher energy), shifting the observed colour from green (absorbs red) through blue to violet (absorbs yellow-green).
The textbook uses this sequence to illustrate the spectrochemical series: ligands are ranked by their ability to split orbitals. Here, en lies above in the series, so each substitution raises . The colour change is a direct visual demonstration of the relation:
where:
- = crystal field splitting energy for an octahedral complex (J or eV)
- = Planck’s constant ()
- = speed of light ()
- = wavelength of light absorbed (m or nm) …
Colour in gemstones
The same principle — – transitions at transition-metal centres embedded in an otherwise colourless host lattice — accounts for the colour of certain gemstones:
Drawn by us to help you understand the concept clearly, and verified to make sure it's accurate. For exams, practice from your NCERT textbook's own diagram.
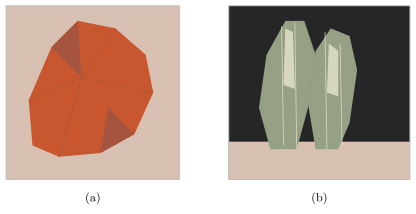
Figure 5.12 shows two photographs of gemstones: (a) a red ruby and (b) a green emerald. Both derive their colour from the same transition metal ion — (a system) — but the surrounding crystal lattice differs. In ruby, substitutes for in corundum (), where it experiences an octahedral ligand field from oxide ions. In emerald, is embedded in beryl (a beryllium aluminium silicate), where the ligand field is also octahedral but the ligands (oxygen atoms from silicate groups) produce a different crystal field splitting energy.
The physical idea is that the colour of a coordination compound arises from – transitions of electrons between split orbitals. The energy difference (crystal field splitting energy) determines which wavelength of light is absorbed. The complementary colour is observed. For in ruby, is larger, so it absorbs blue-green light and appears red. In emerald, is smaller, so it absorbs red light and appears green.
The key formula linking the absorbed wavelength to the splitting energy is:
where:
- = crystal field splitting energy (J or eV)
- = Planck’s constant ()
- = speed of light ()
- = wavelength of absorbed light (m) …
…