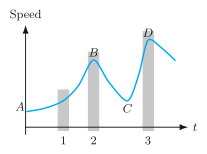
Q.Figure 2.15 gives a speed-time graph of a particle in motion along a constant direction. Three equal intervals of time are shown. In which interval is the average acceleration greatest in magnitude? In which interval is the average speed greatest? Choosing the positive direction as the constant direction of motion, give the signs of and in the three intervals. What are the accelerations at the points A, B, C and D?
You're viewing a preview — the full solution, concept, methods & PYQ mapping are locked.
Start your 14-day free trial to unlock the full solution →On a speed-time graph, the slope is the acceleration and the height is the speed. The steepest slope over an equal interval is the fall from peak B to trough C (interval 2), so the greatest average acceleration magnitude is there; the highest part of the curve is around peak D (interval 3), so the greatest average speed is there. Motion stays in one direction, so always; is positive while speed rises and negative while it falls; and at the turning points A, B, C, D the slope is zero, so .
Concept
For a speed-time graph of motion in a fixed direction:
The three intervals have equal duration, so comparisons reduce to comparing the change in speed (for acceleration) and the typical height (for speed).
Greatest average acceleration
- Interval 1: speed rises A → B (a moderate increase).
- Interval 2: speed falls from the high peak B down to the trough C — the largest change in speed over an equal time, hence the steepest chord.
- Interval 3: speed rises C → D.
The biggest magnitude of occurs in interval 2.
Greatest average speed
The average speed over an interval corresponds to how high the curve lies there. The curve reaches its highest values near the tall second peak D, which is in interval 3. So the average speed is greatest in interval 3.
Signs of and
The particle moves in a constant (positive) direction, so its velocity is positive at all times:
Acceleration has the sign of the slope of the speed-time curve:
- Interval 1 (speed increasing A → B): . …
Unlock everything free for 14 days
- Full step-by-step solutions
- Concept-first explanations
- Methods, shortcuts & mistakes
- PYQ mapping + timed mock tests
Full access for 14 days. No credit card required.